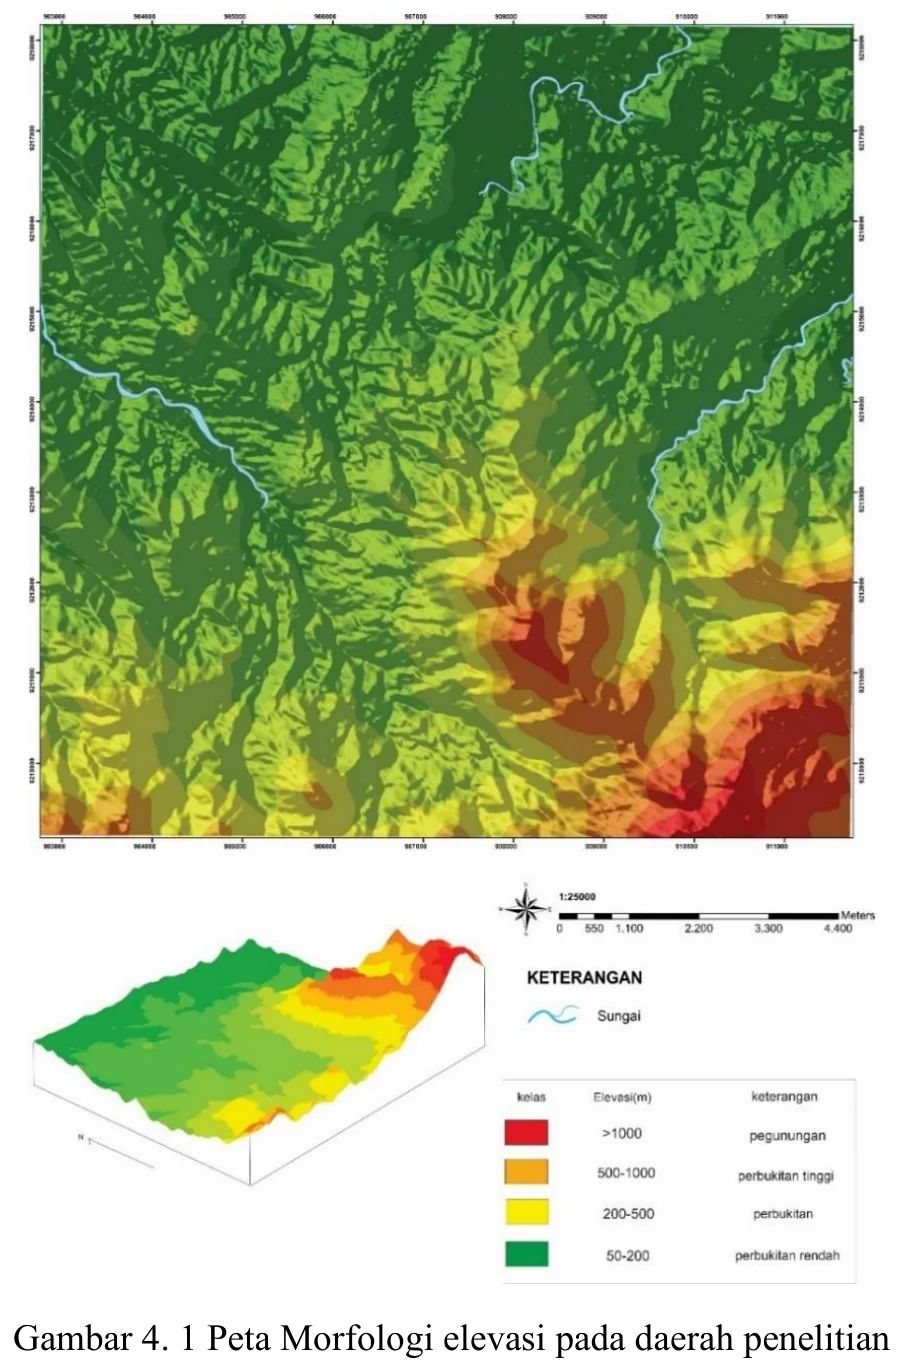
mapping-4-1
Geomorphology base map
Elevation distribution used to define relief, watershed position and the topographic context of mapped units.
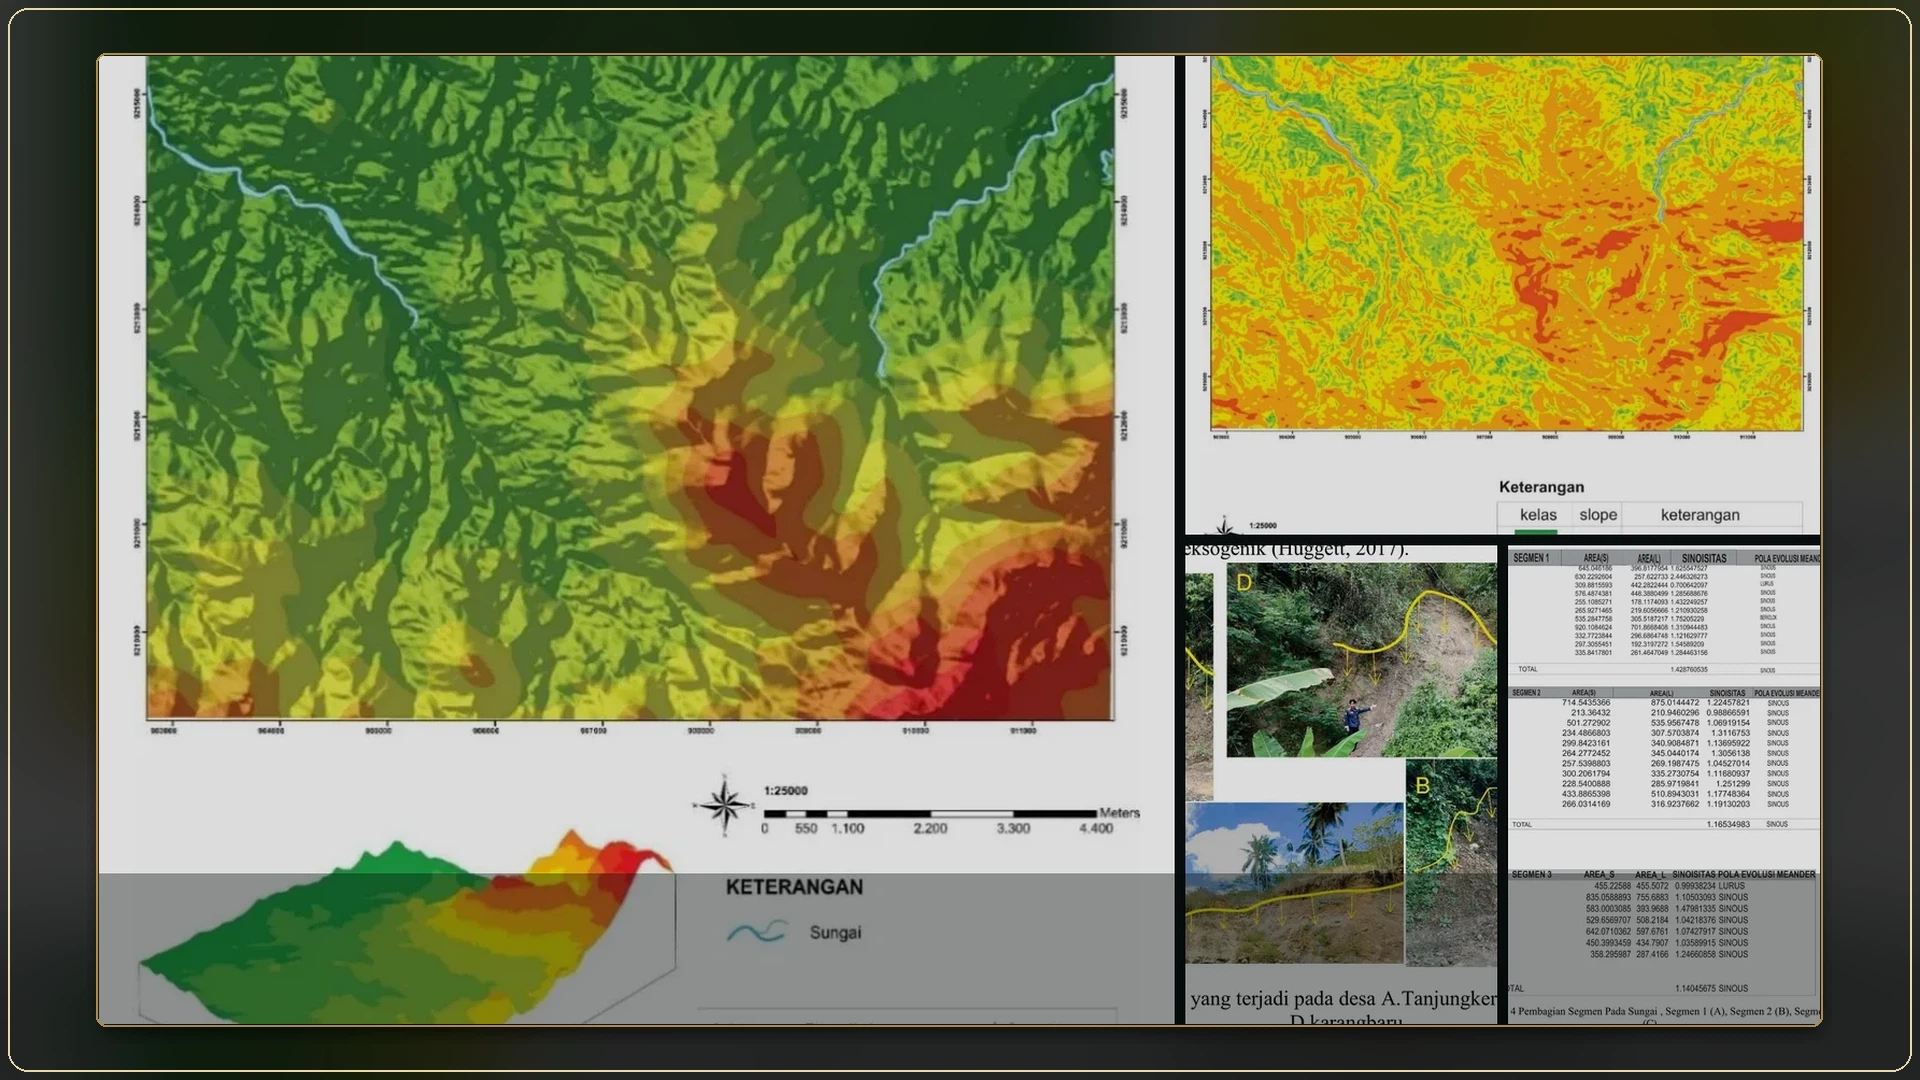
ALBUM
All 41 records are shown below.
Elevation distribution used to define relief, watershed position and the topographic context of mapped units.
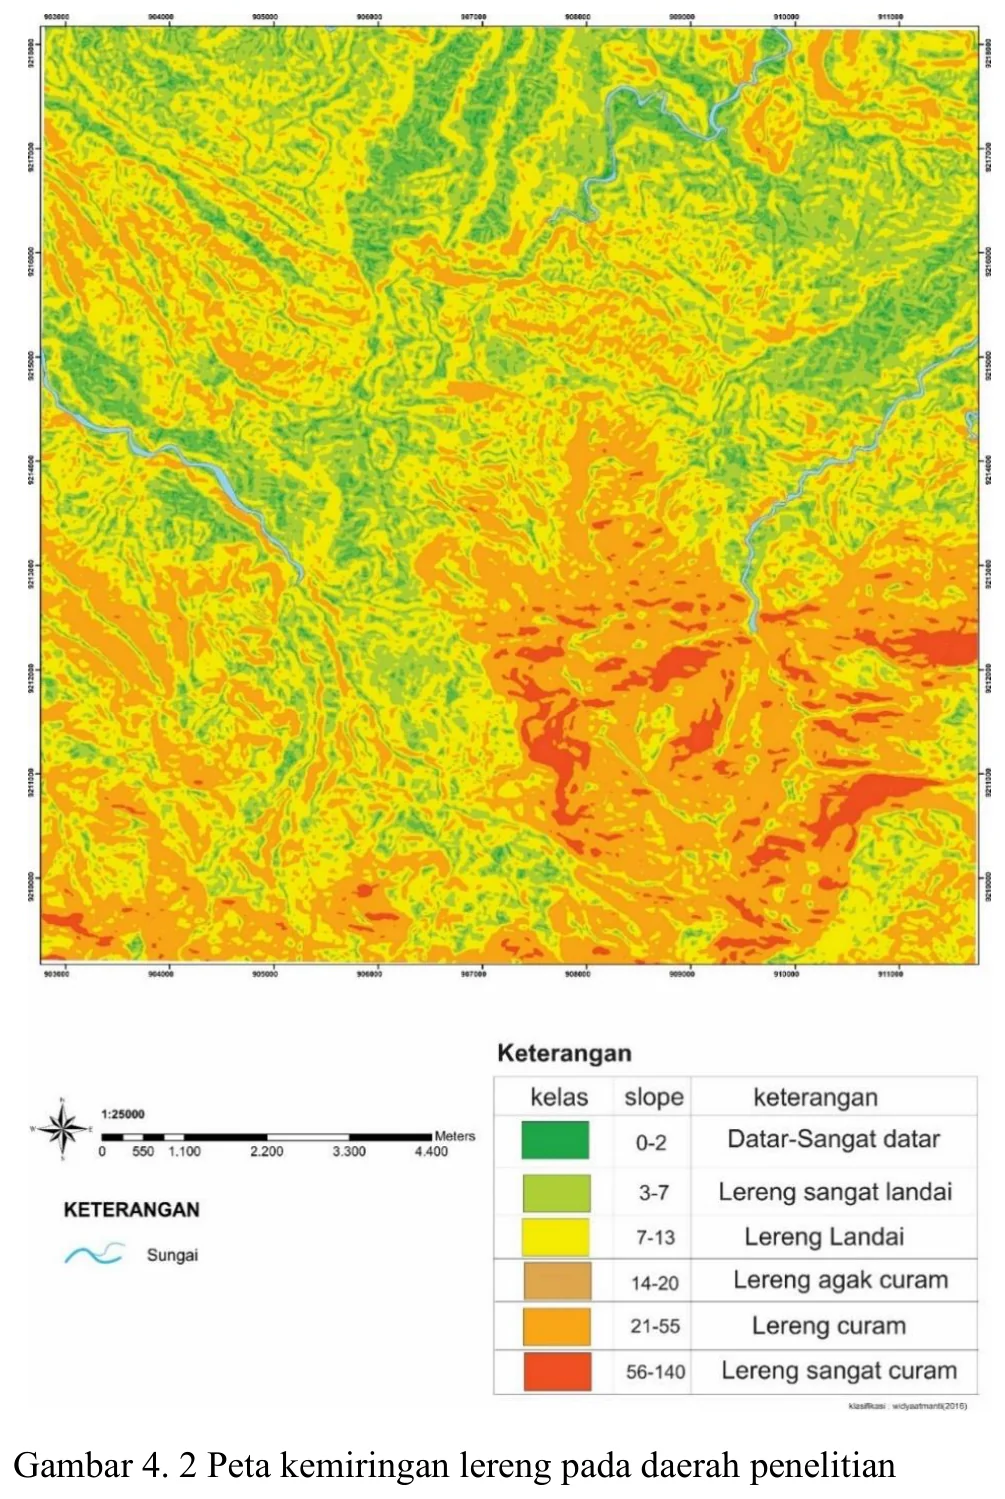
Slope classes support terrain segmentation and field-access or mass-movement interpretation.
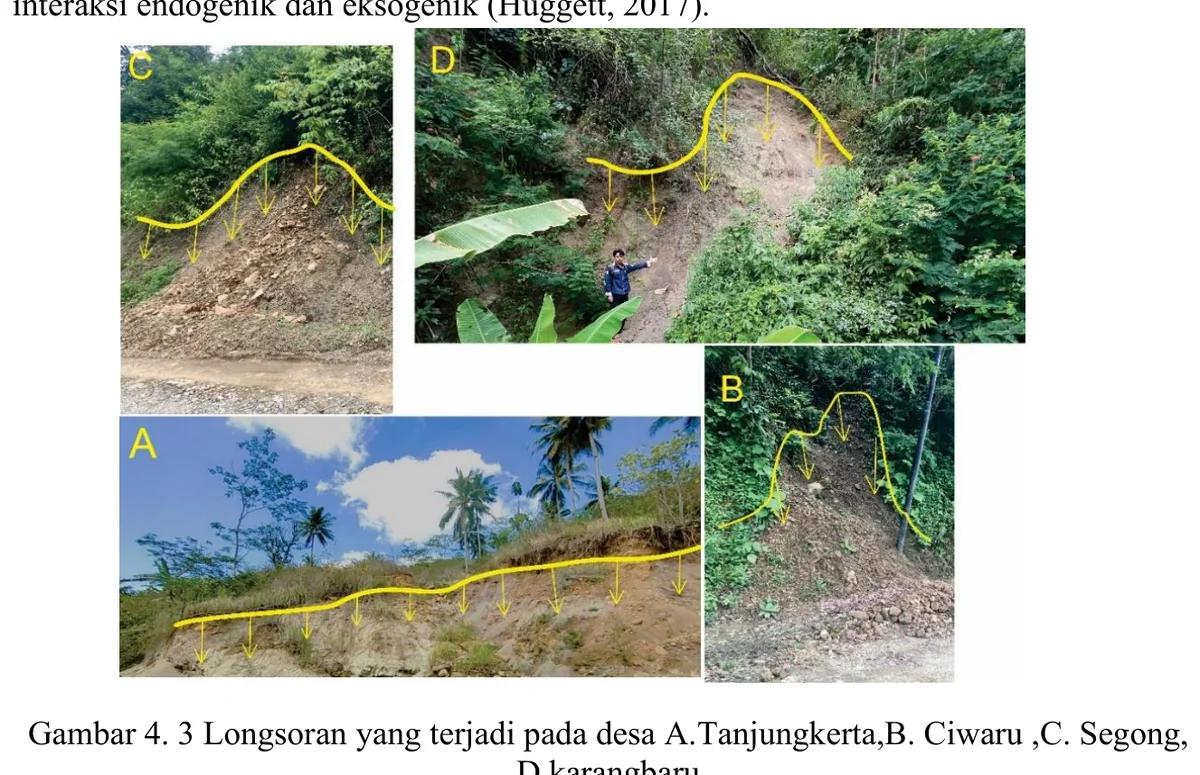
Photographs record slope failures at several villages and connect geomorphic mapping with field evidence.
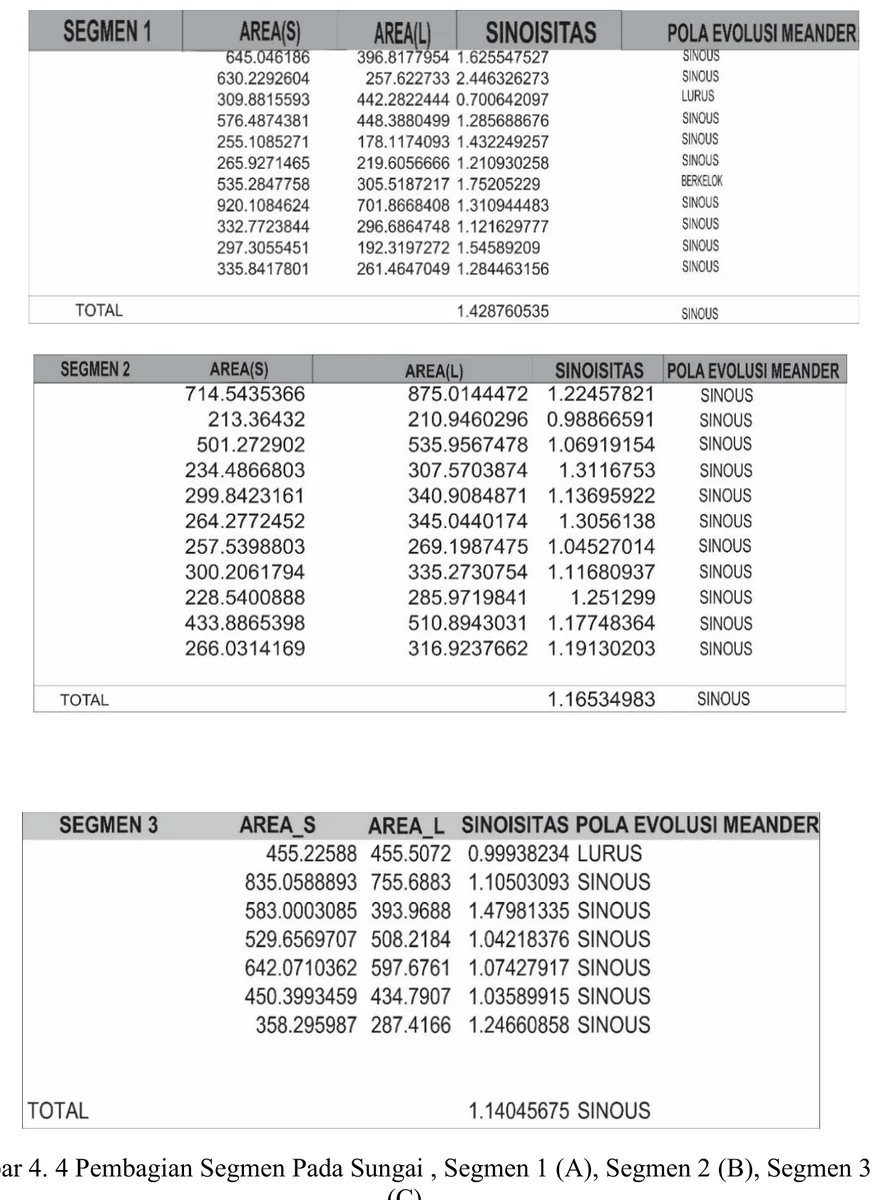
Channel reaches are separated for morphologic comparison.
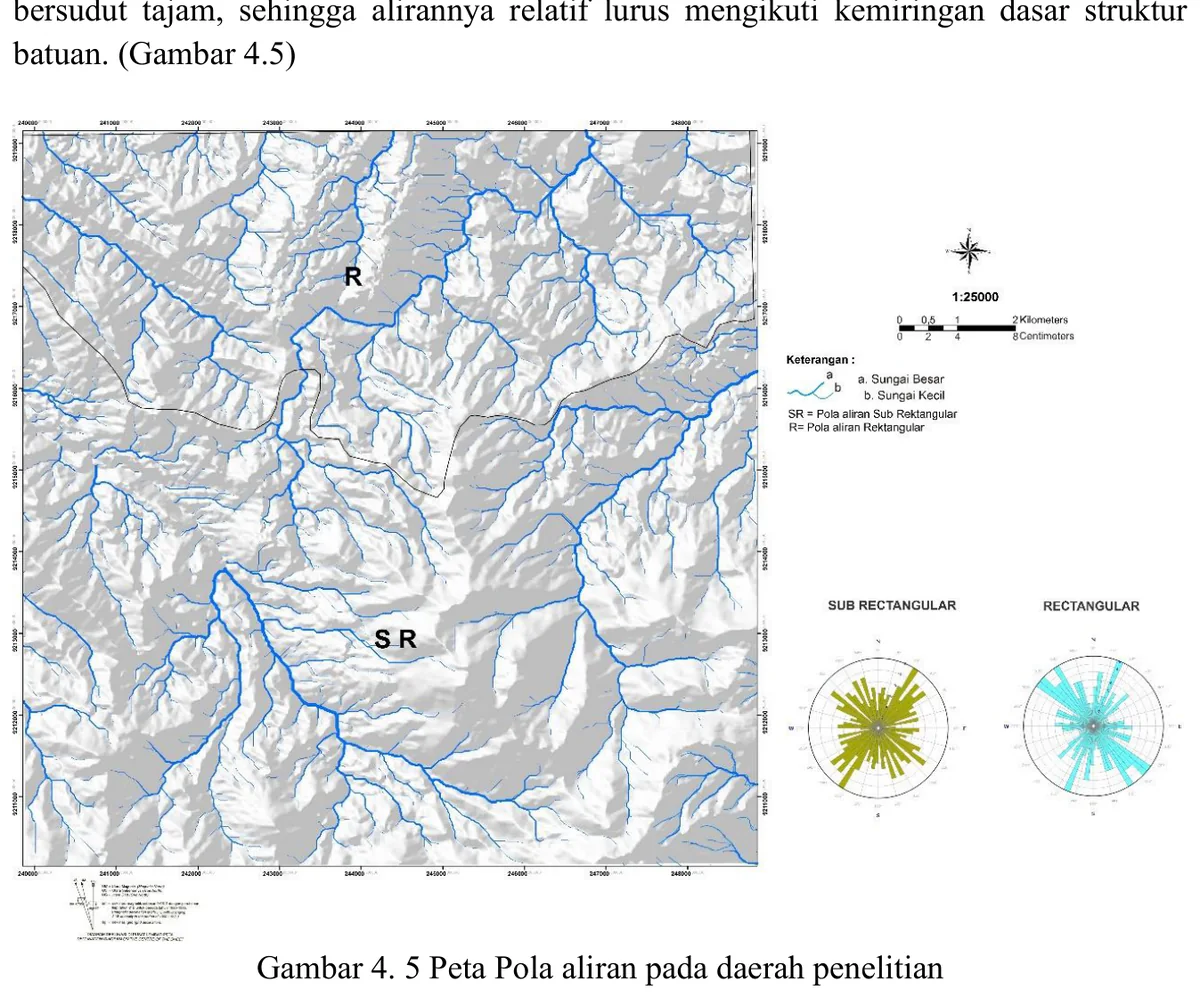
Drainage geometry is used to assess terrain and possible lithologic or structural control.
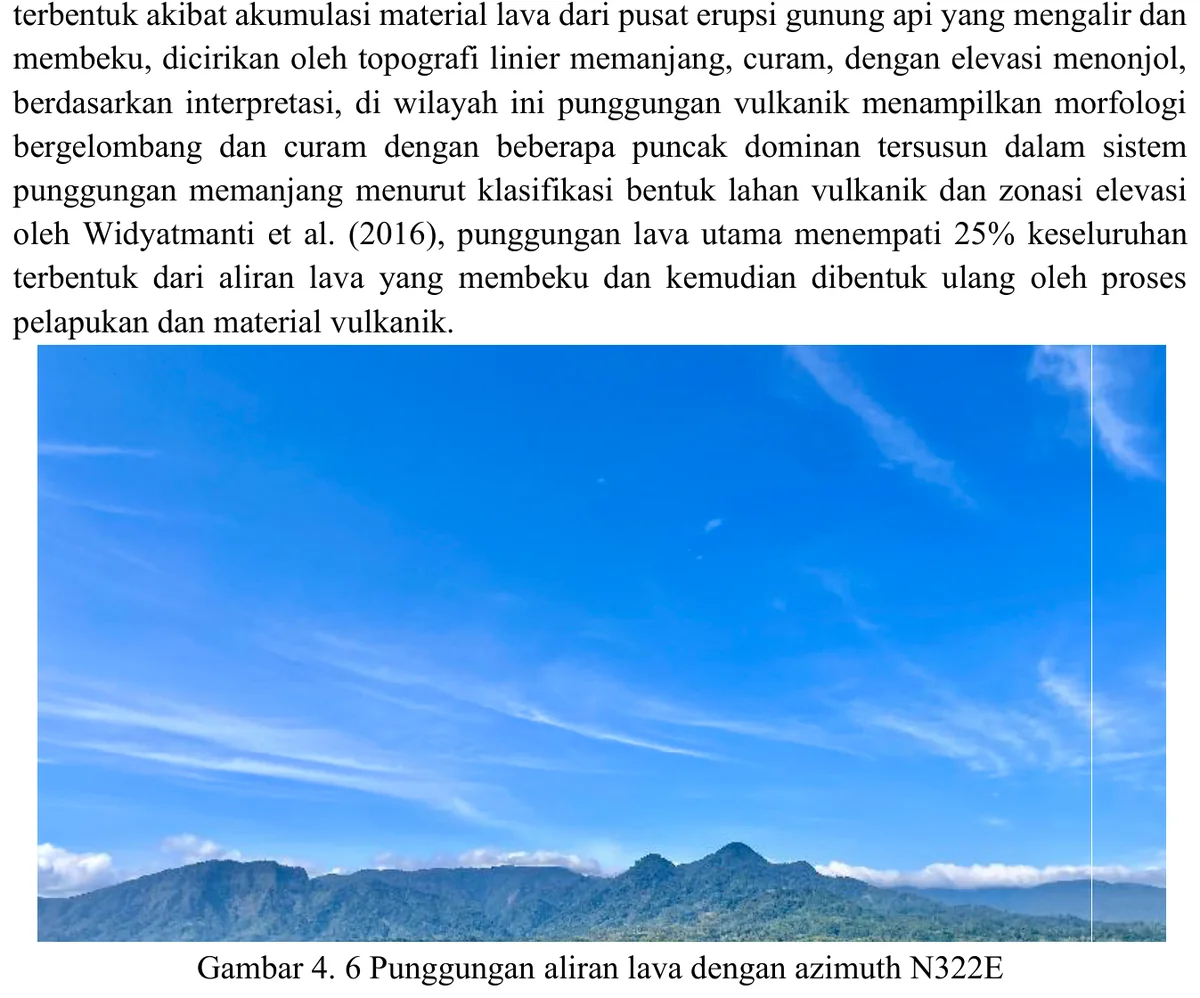
Landscape photograph supports the mapped volcanic geomorphology.
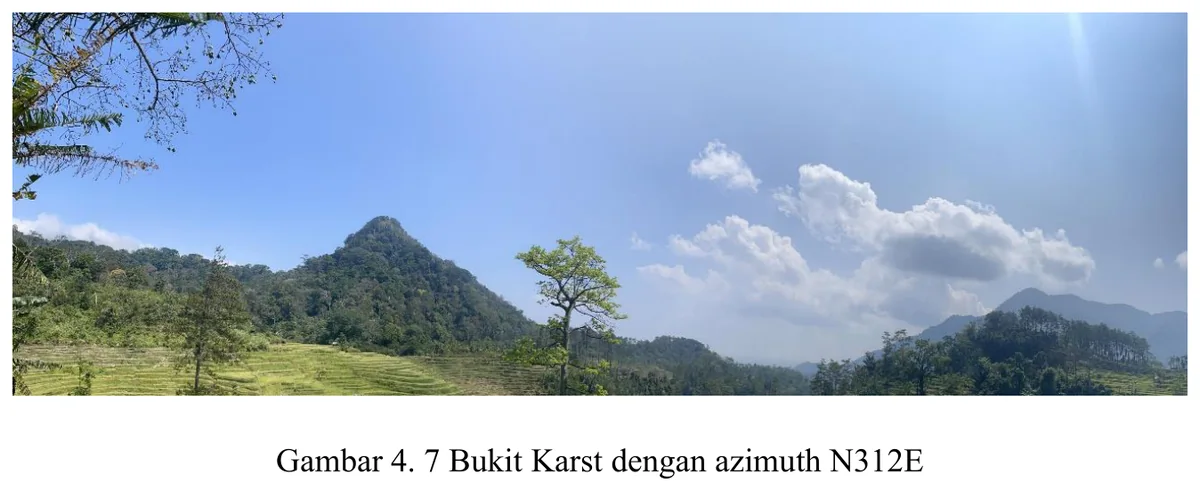
Conical to steep-sided carbonate landform supports the karst geomorphology unit.
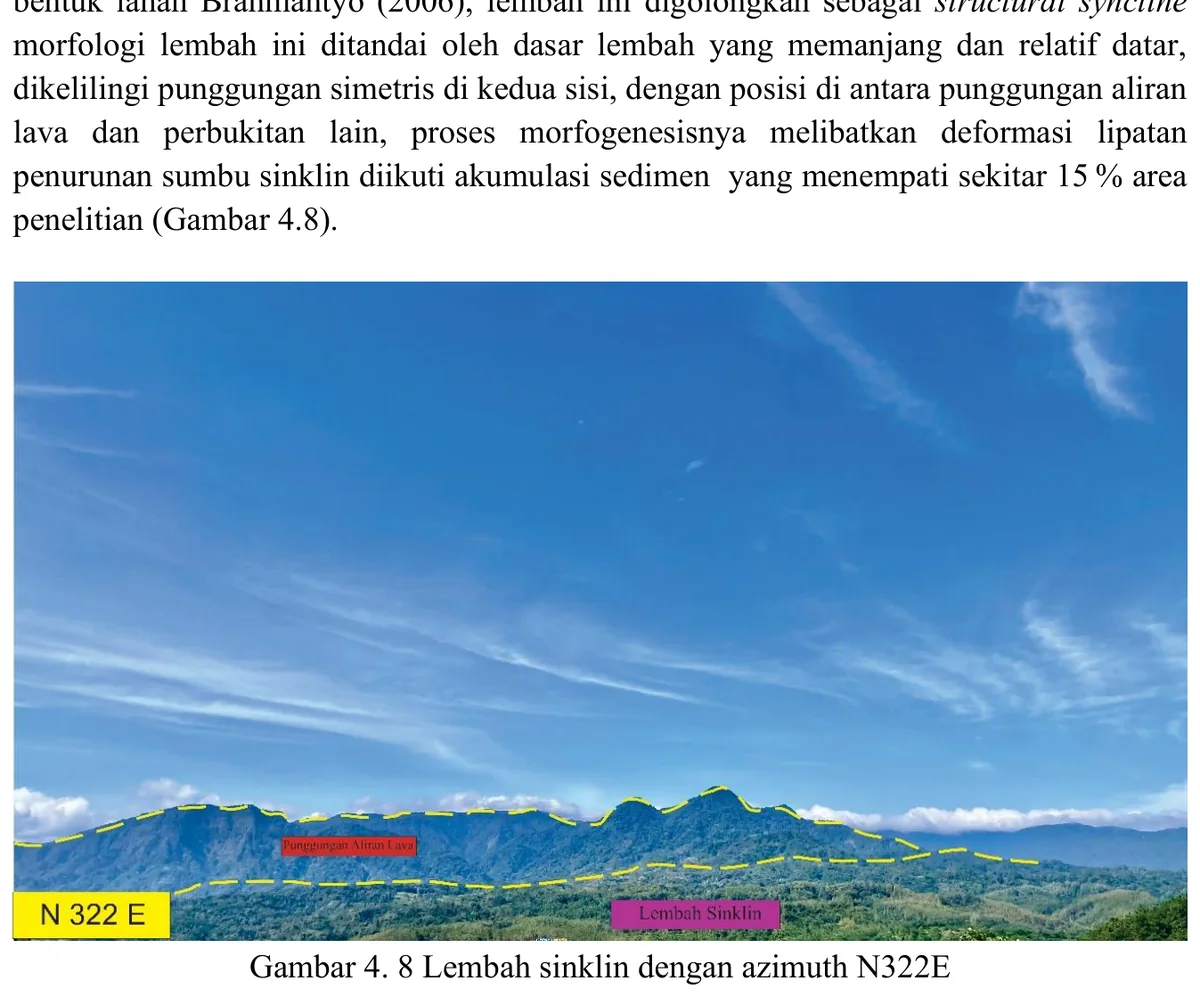
Landscape photograph provides geomorphic context for the mapped fold.
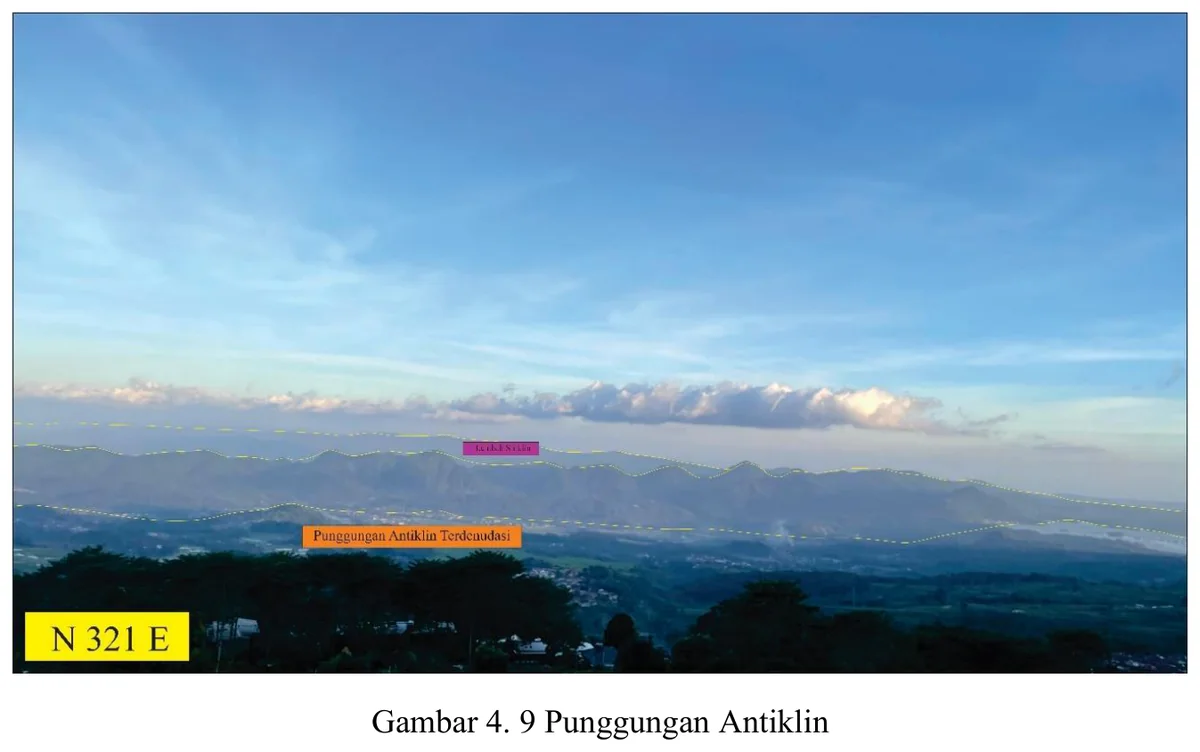
Landscape photograph is used to illustrate the ridge associated with the mapped anticline.
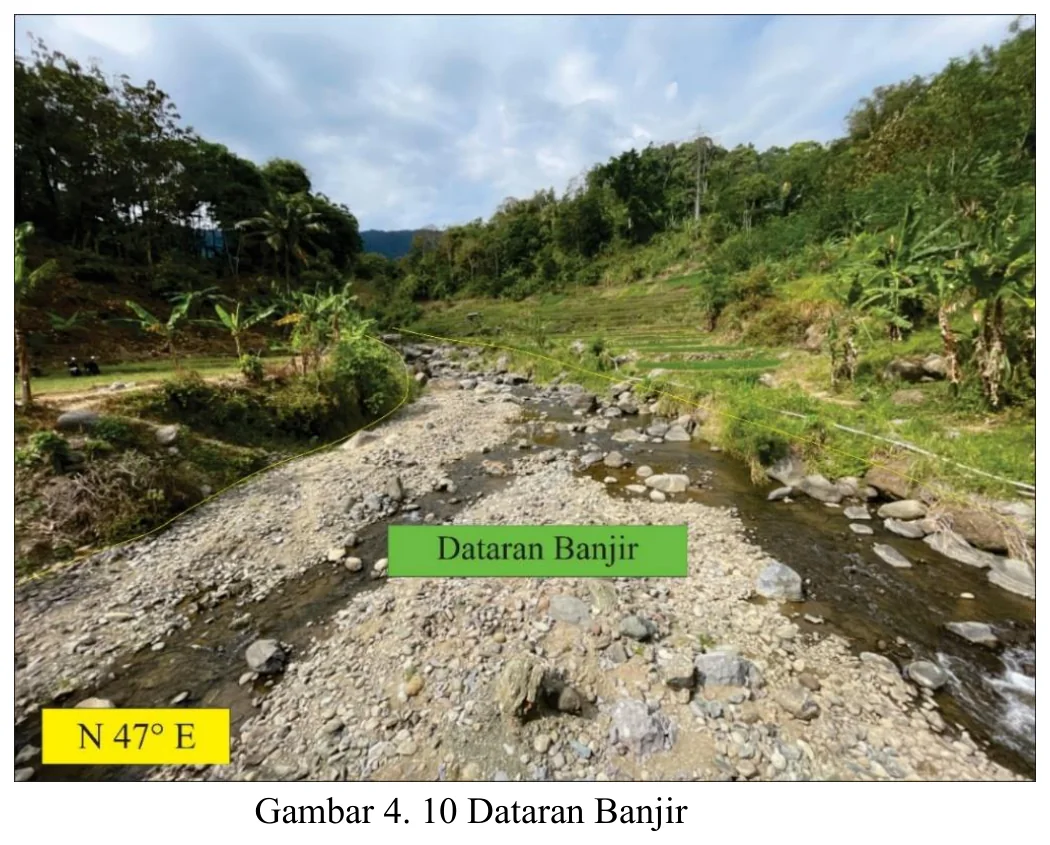
Flat low-relief alluvial surface records active fluvial deposition.
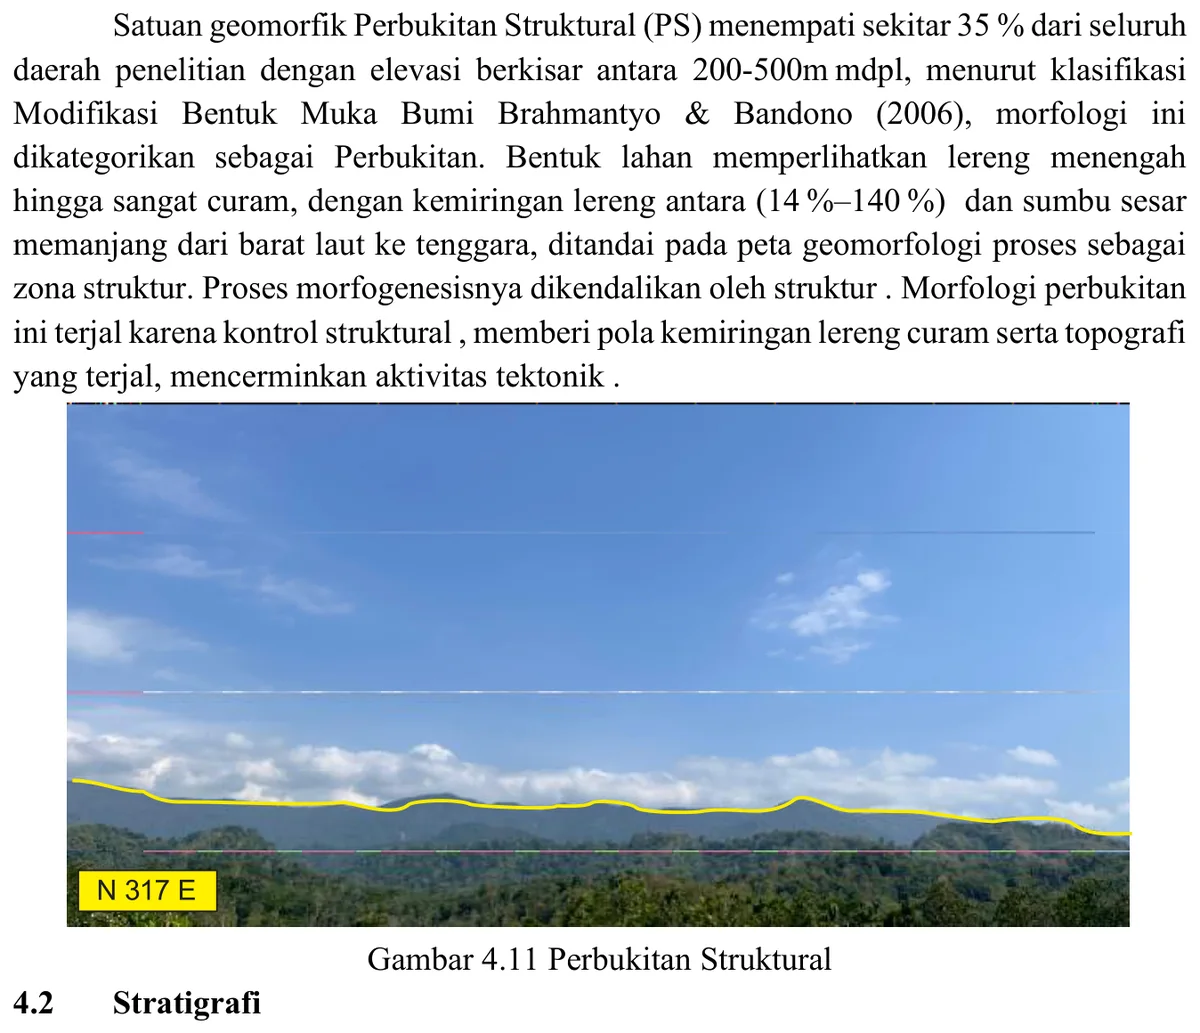
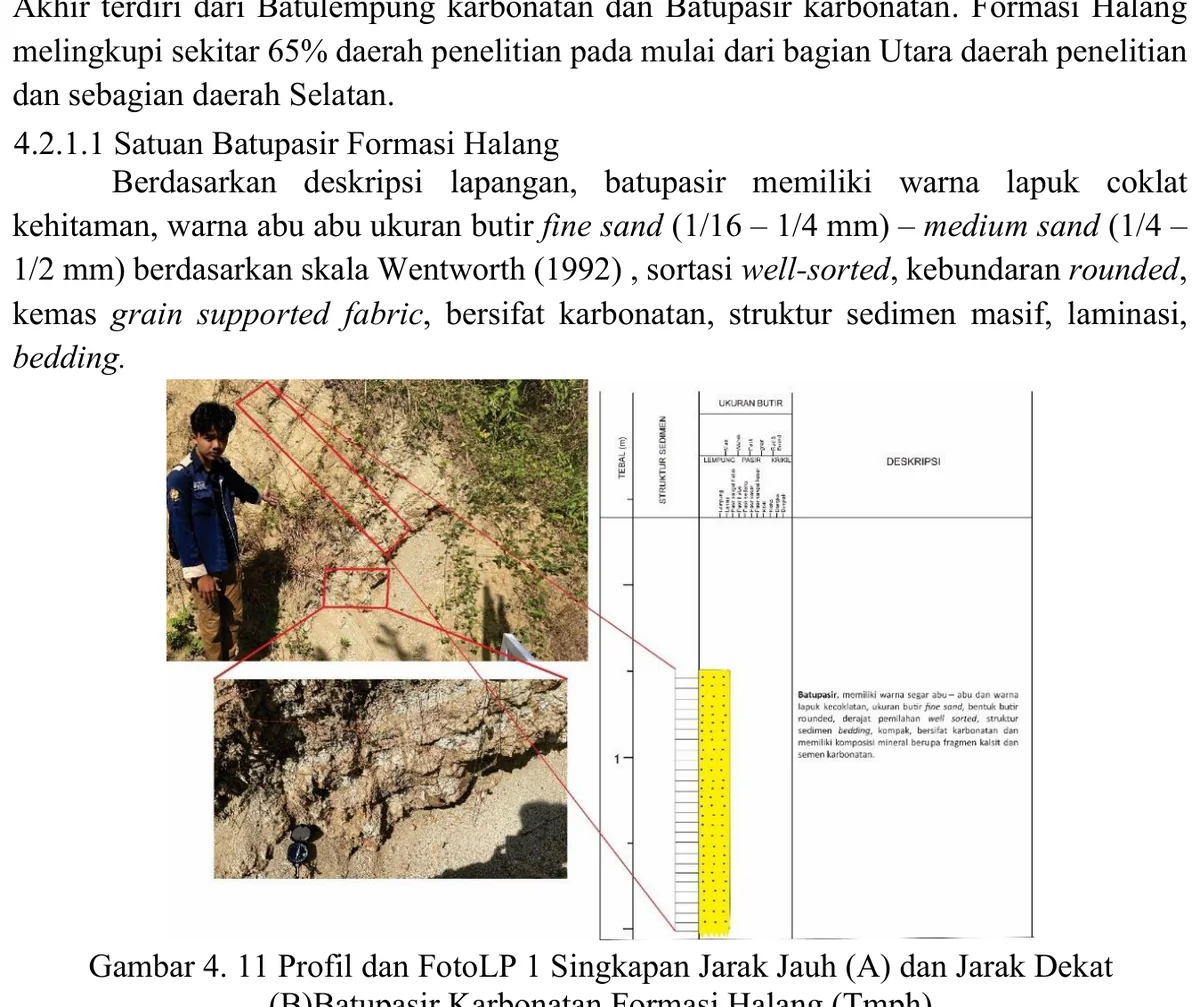
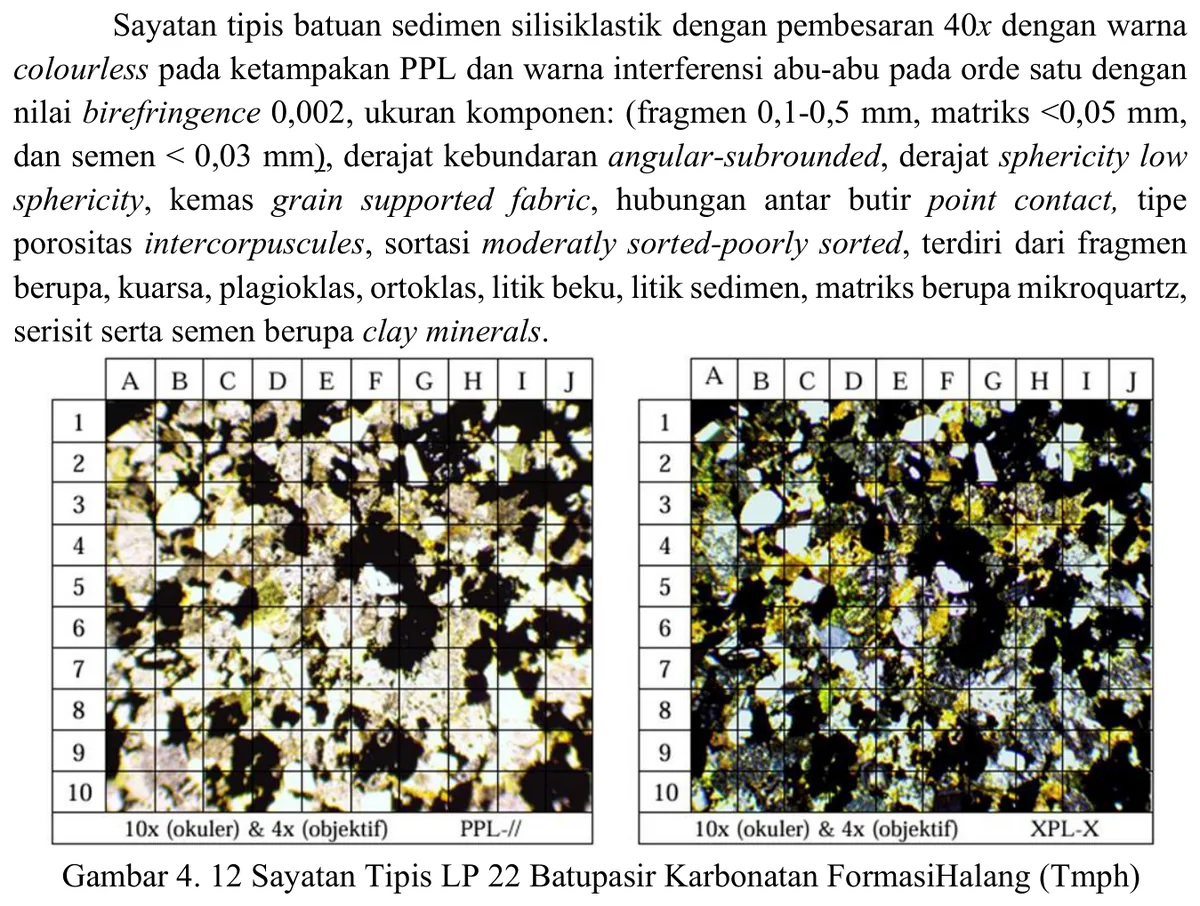
Petrographic image supports mineralogy and texture of the Halang sandstone sample.
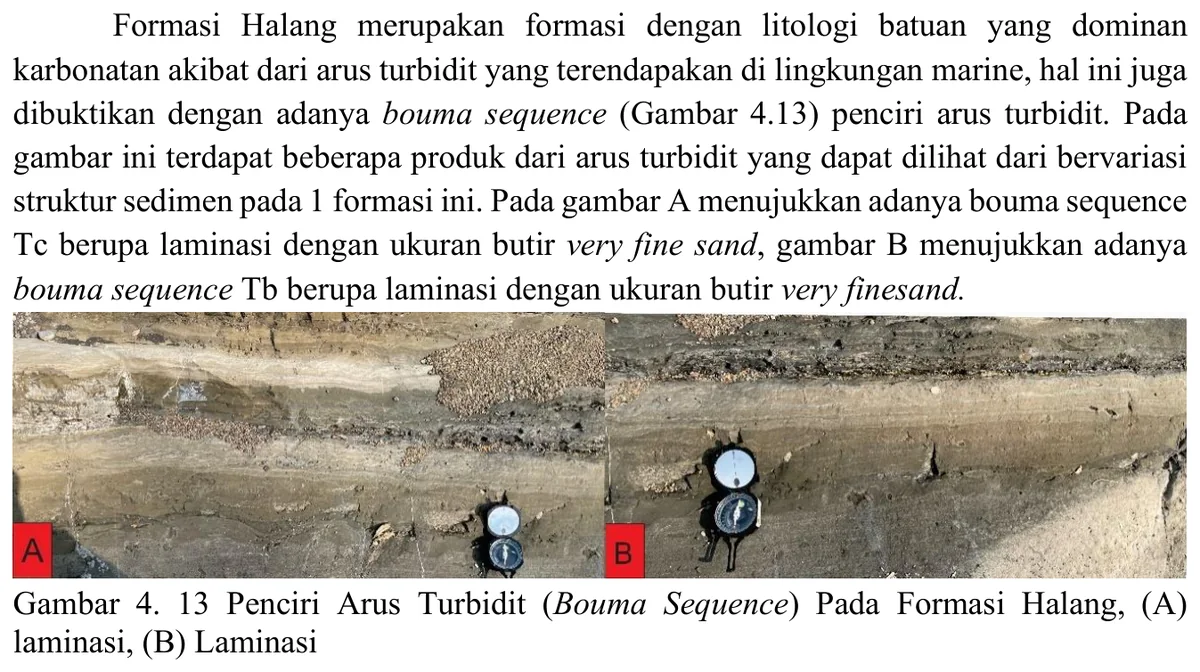
Two close views show thin parallel lamination and grain-size contrast.
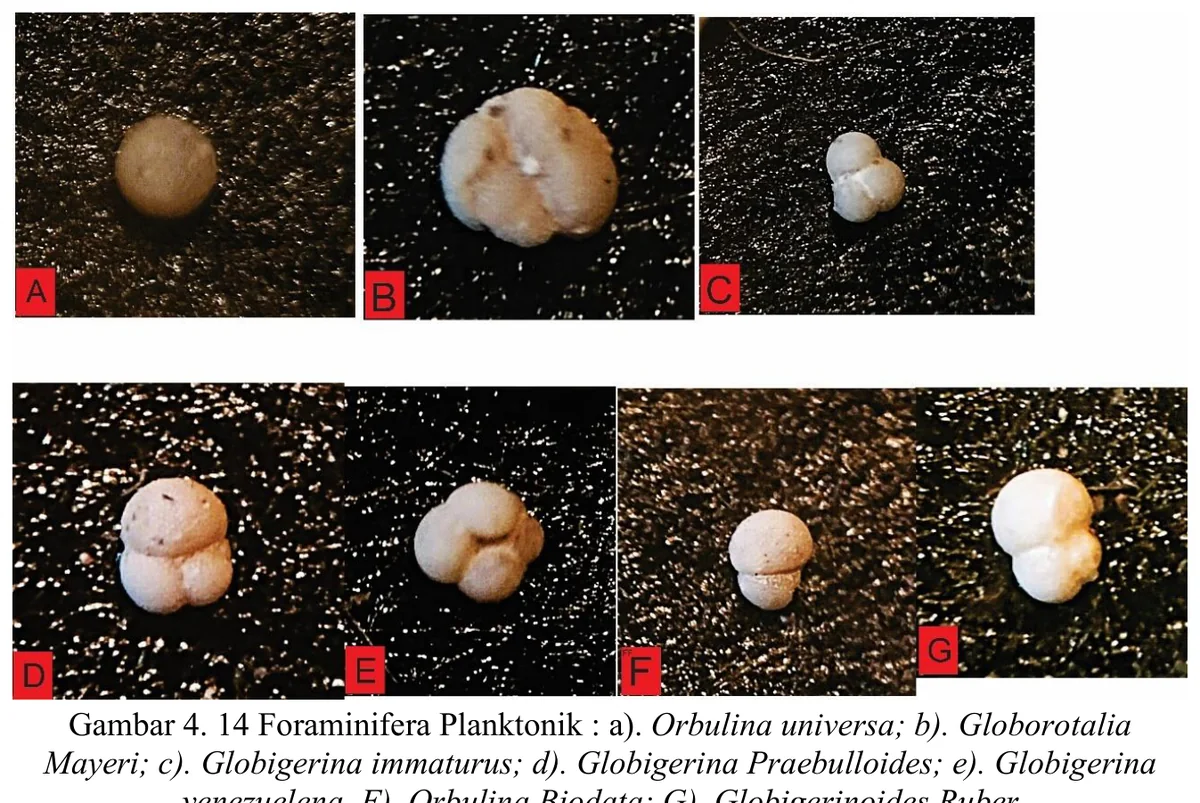
Taxonomic plate provides material for relative-age interpretation.
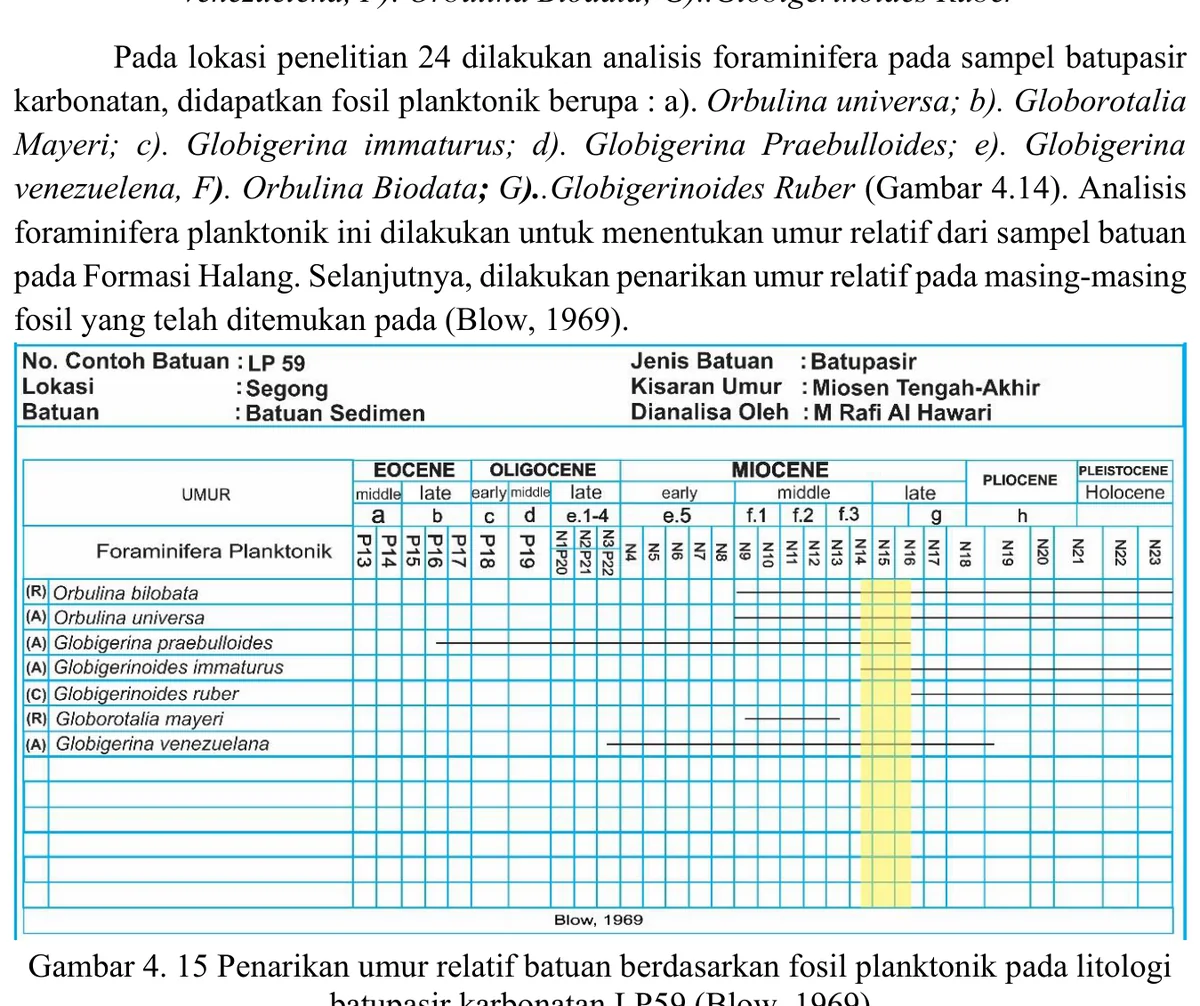
Range overlap is intended to constrain the age of the Halang sandstone sample.
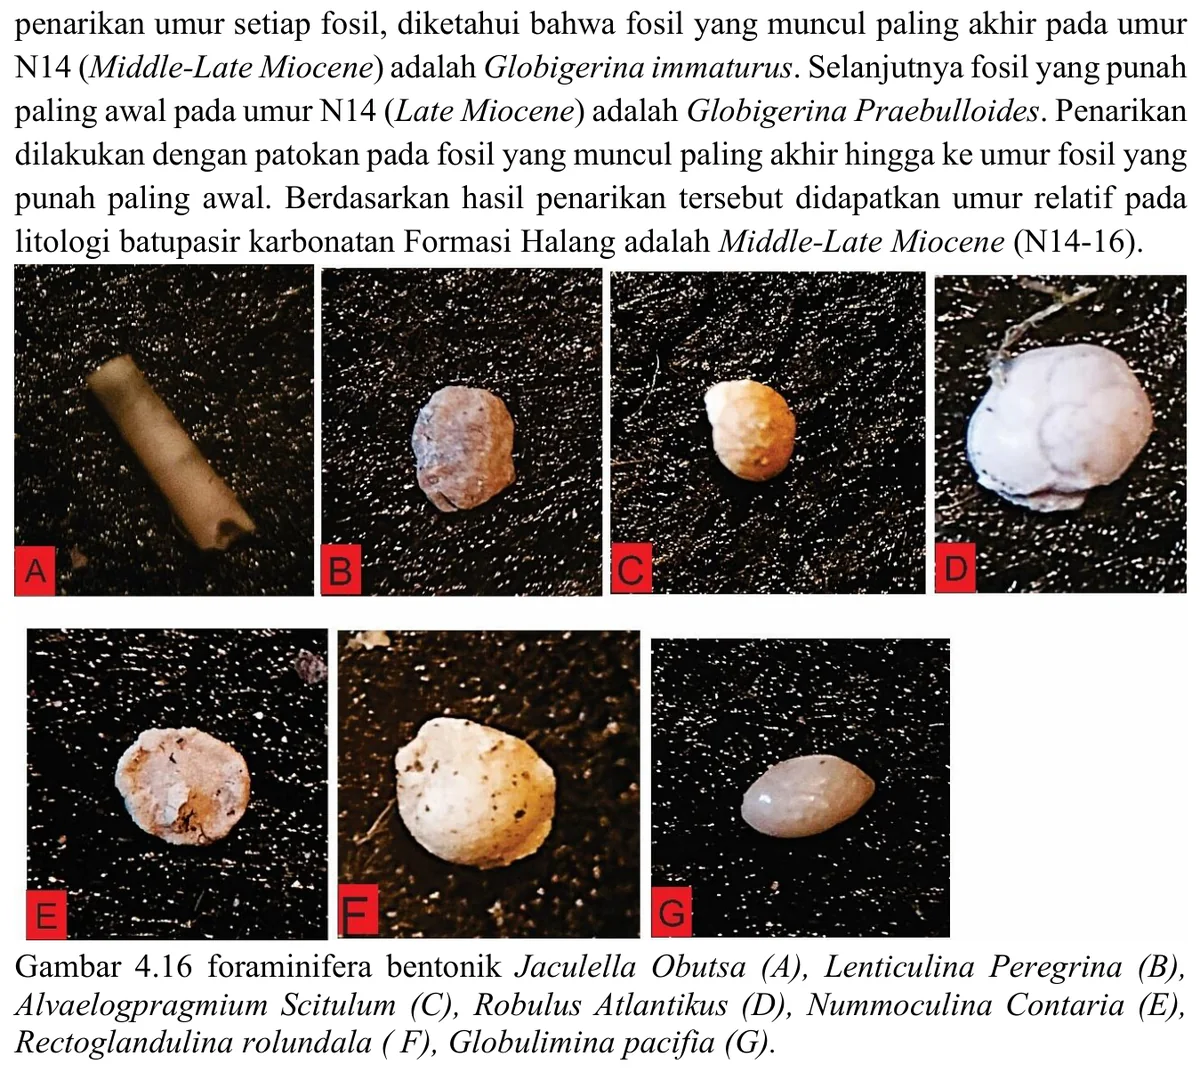
Benthic assemblage is used for palaeobathymetric interpretation.
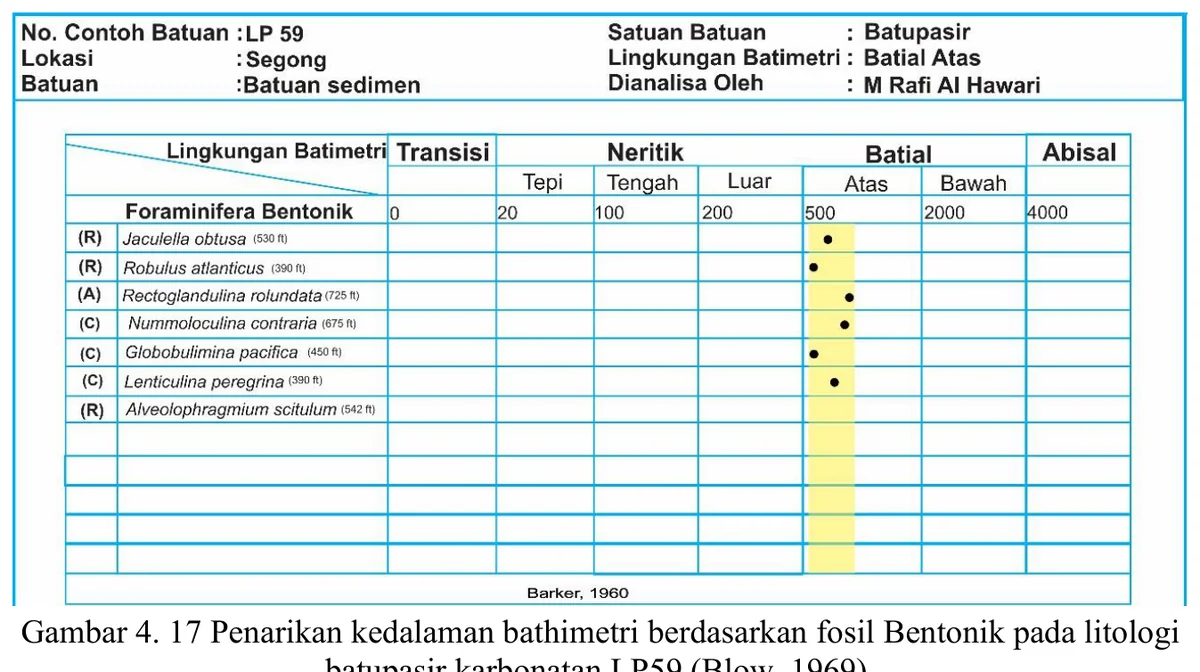
Ecological ranges are combined to infer depositional depth.
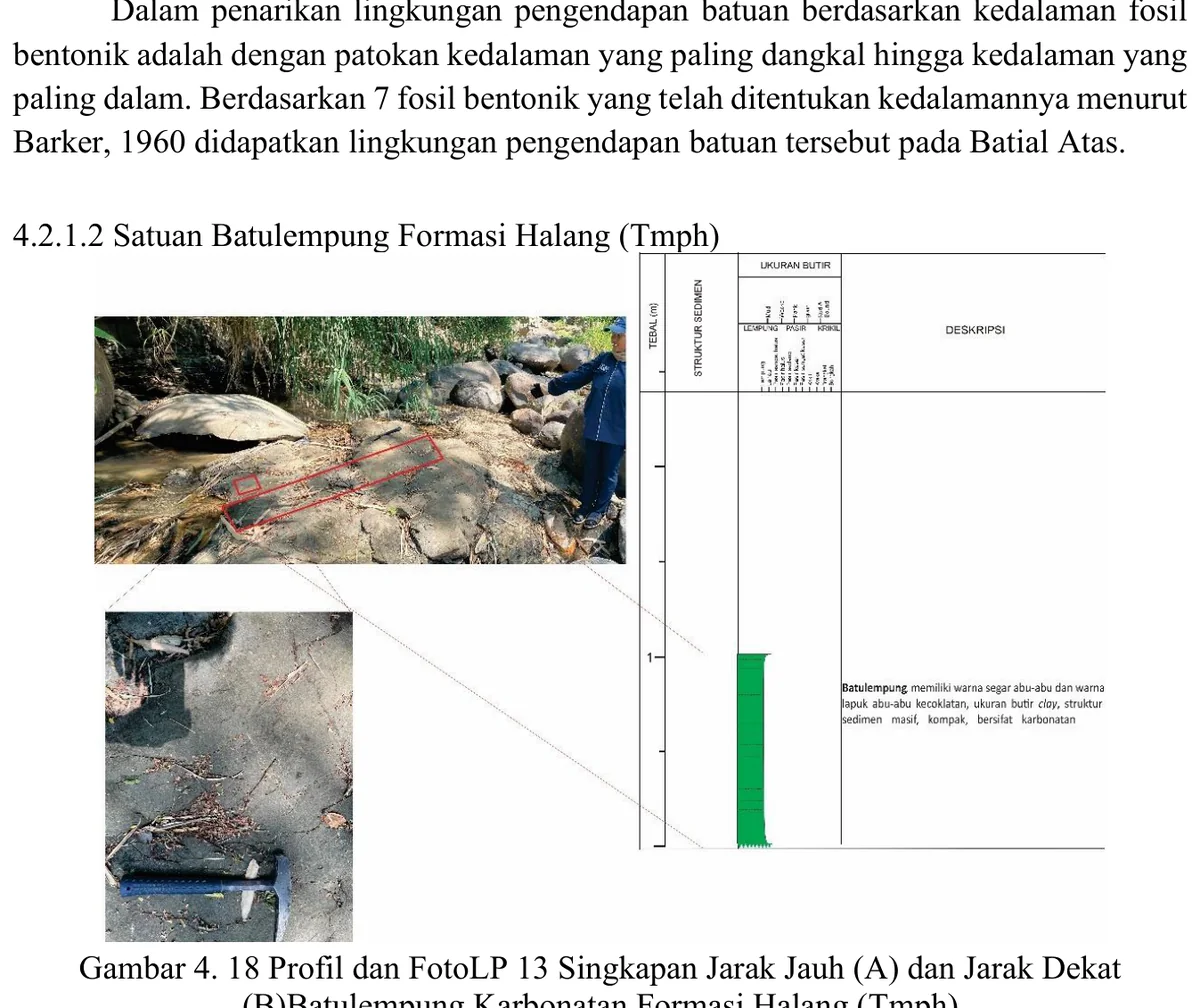
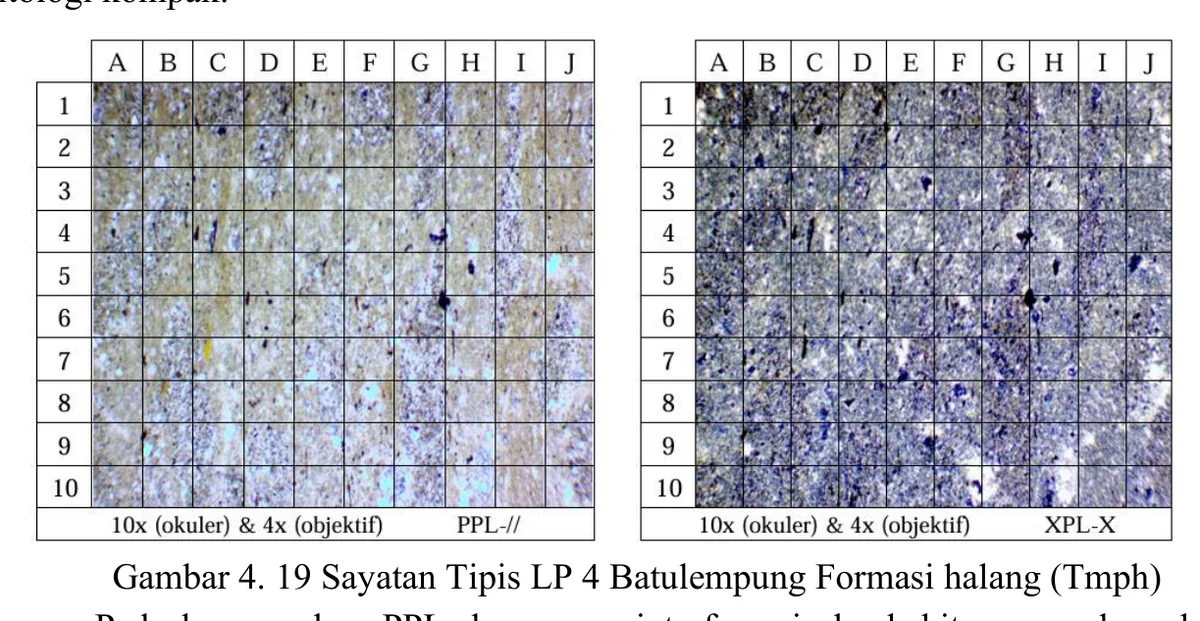
Petrography is used to support the fine-grained Halang unit.
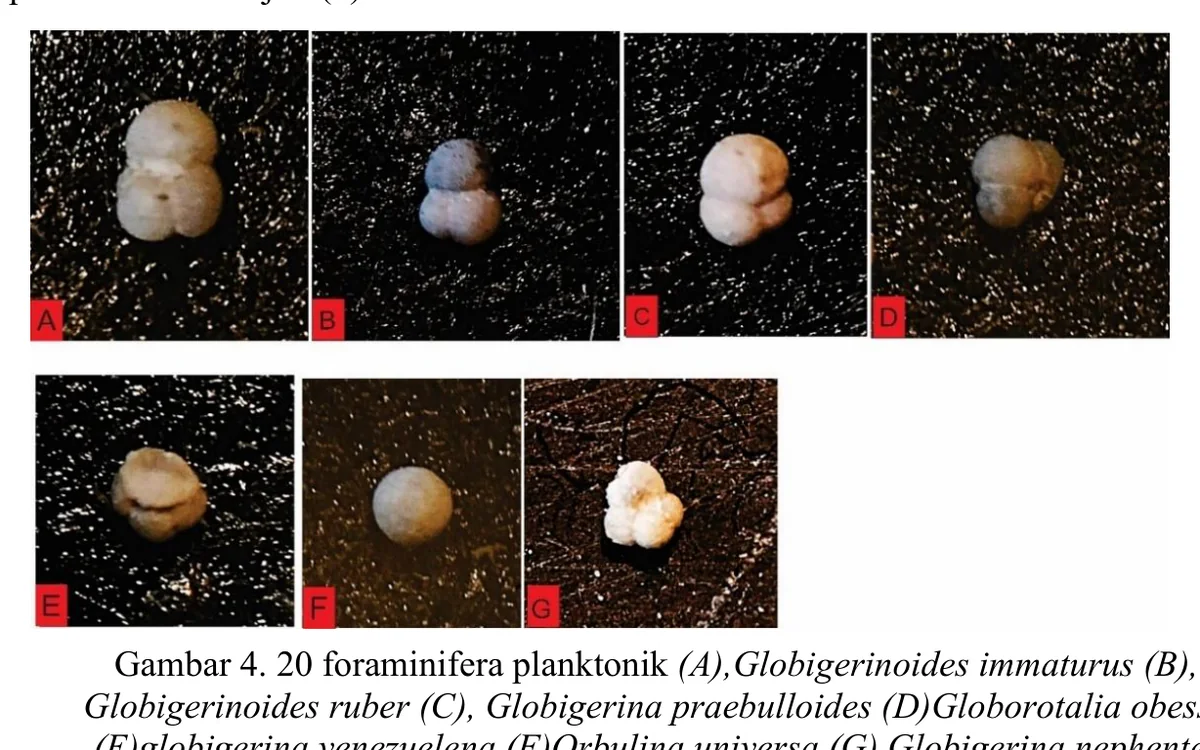
Assemblage supports relative-age analysis of the Halang fine-grained unit.
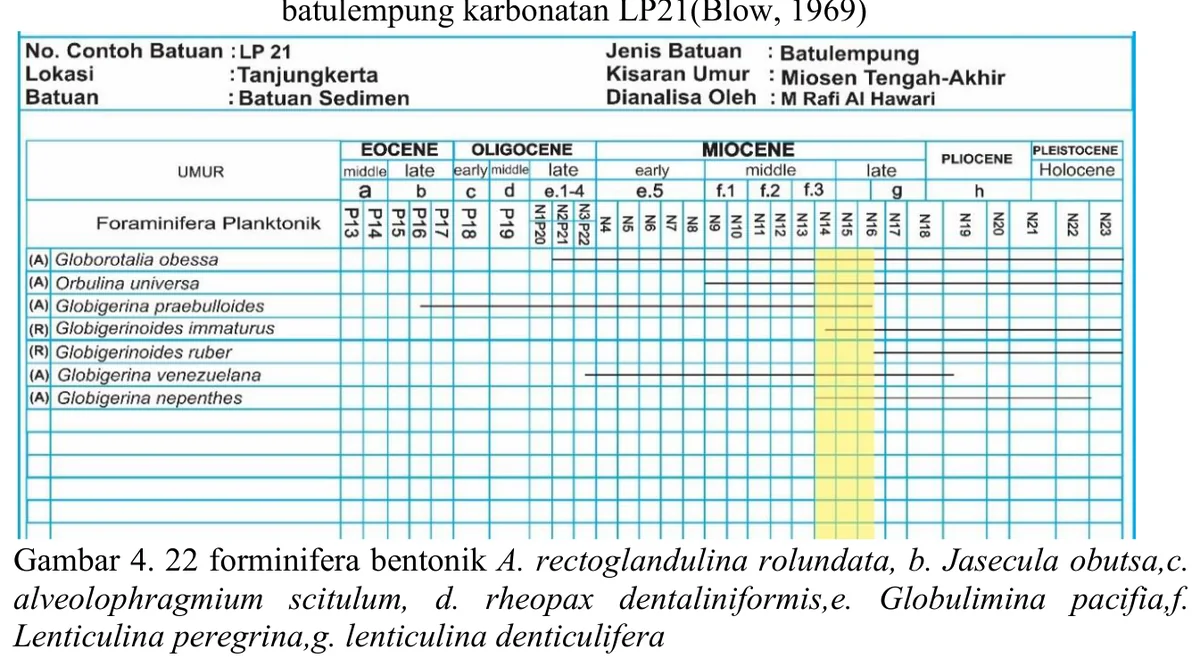
Range overlap is intended to date the claystone sample.
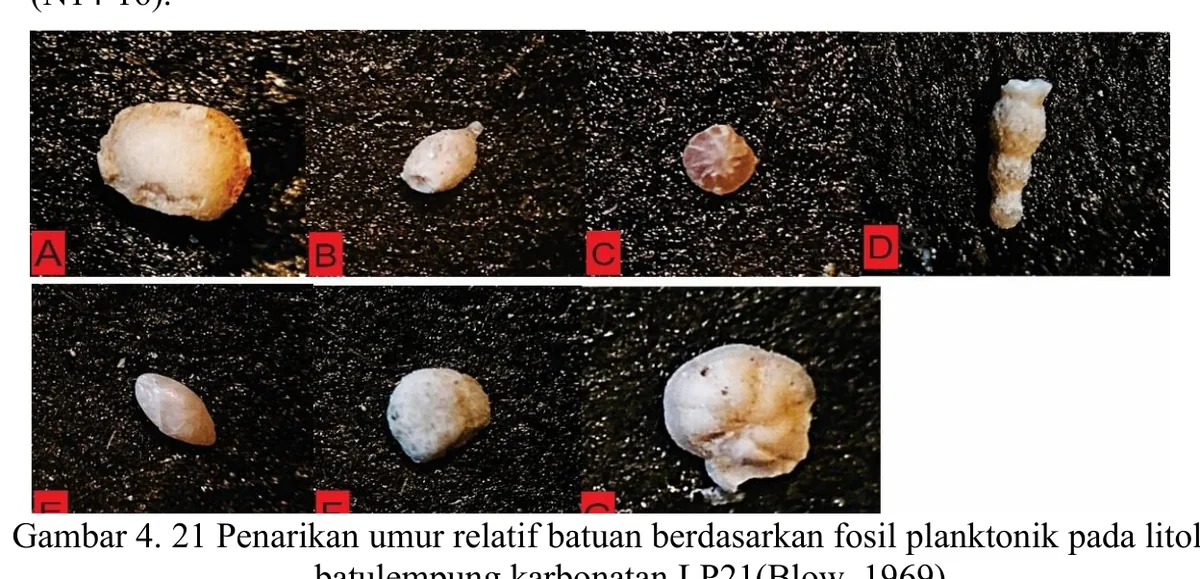
Assemblage supports environmental interpretation.
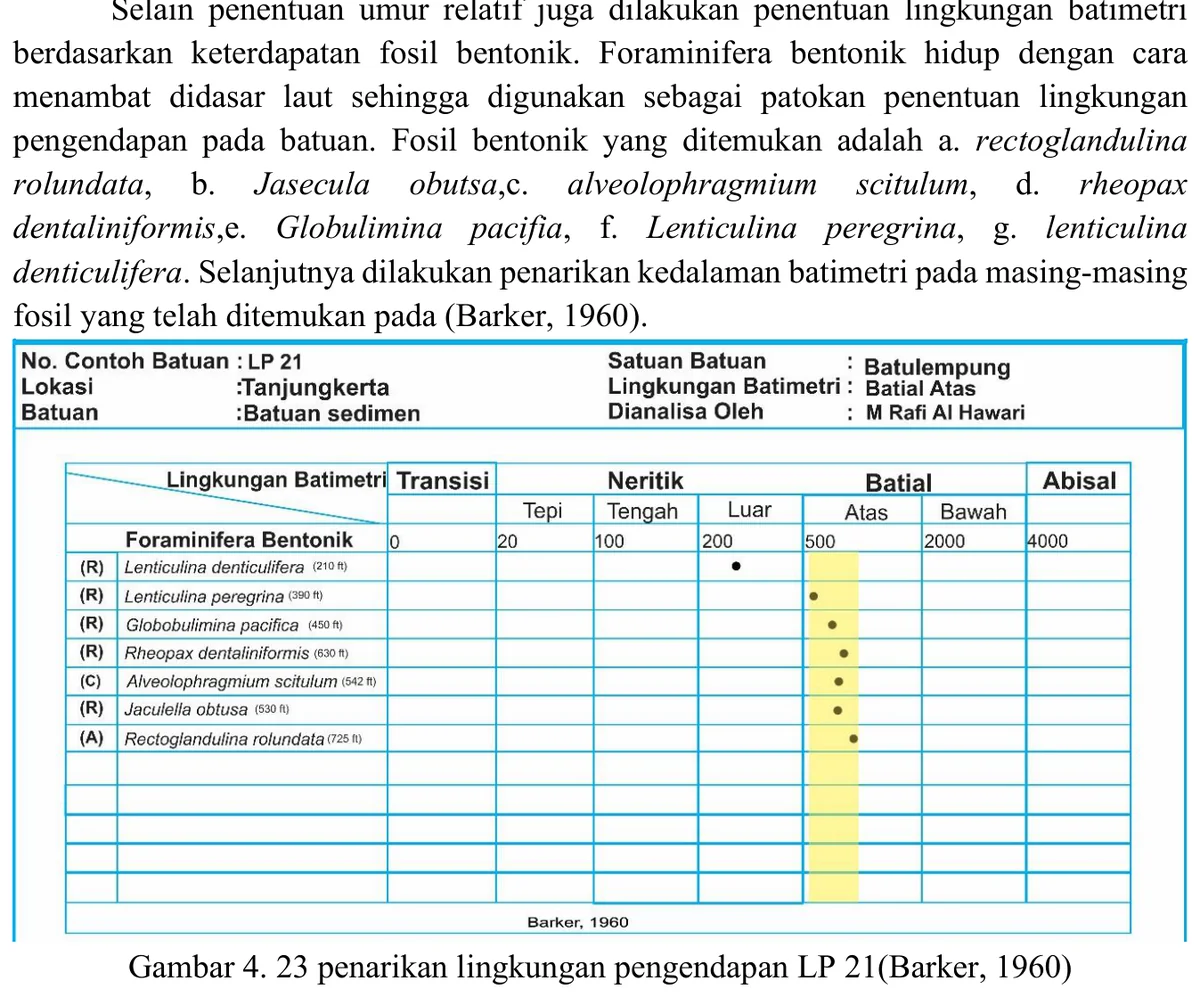
Range chart attempts to place the sample within upper bathyal conditions.
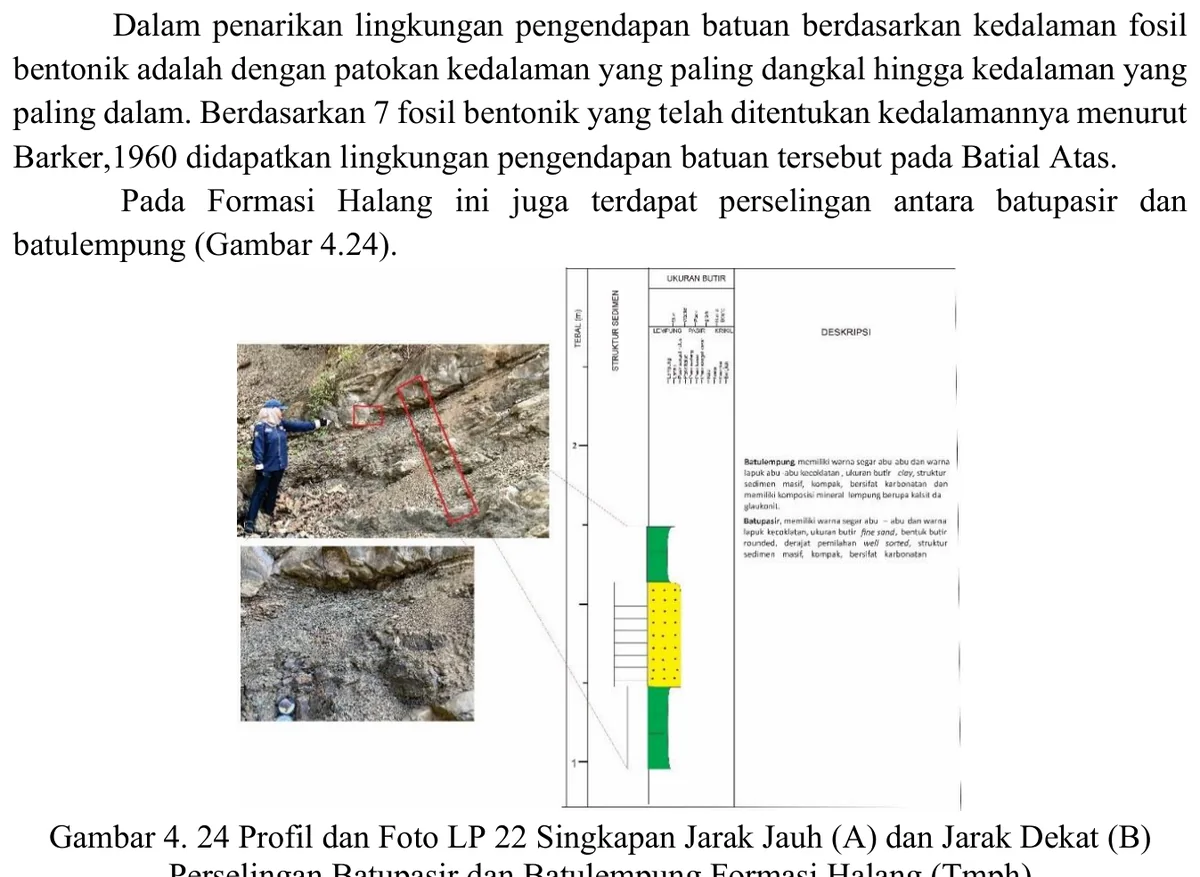
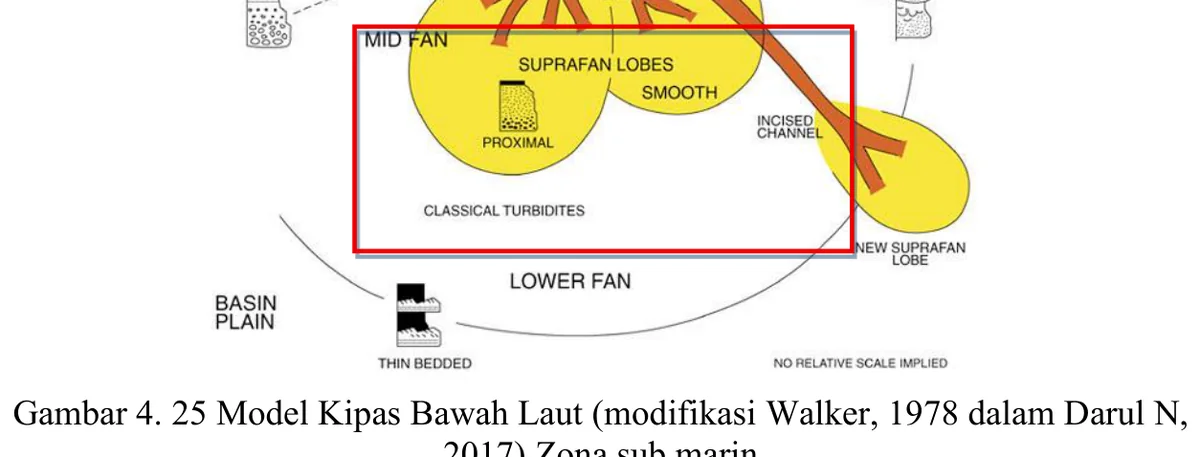
The model provides a framework for comparing observed facies with fan elements.
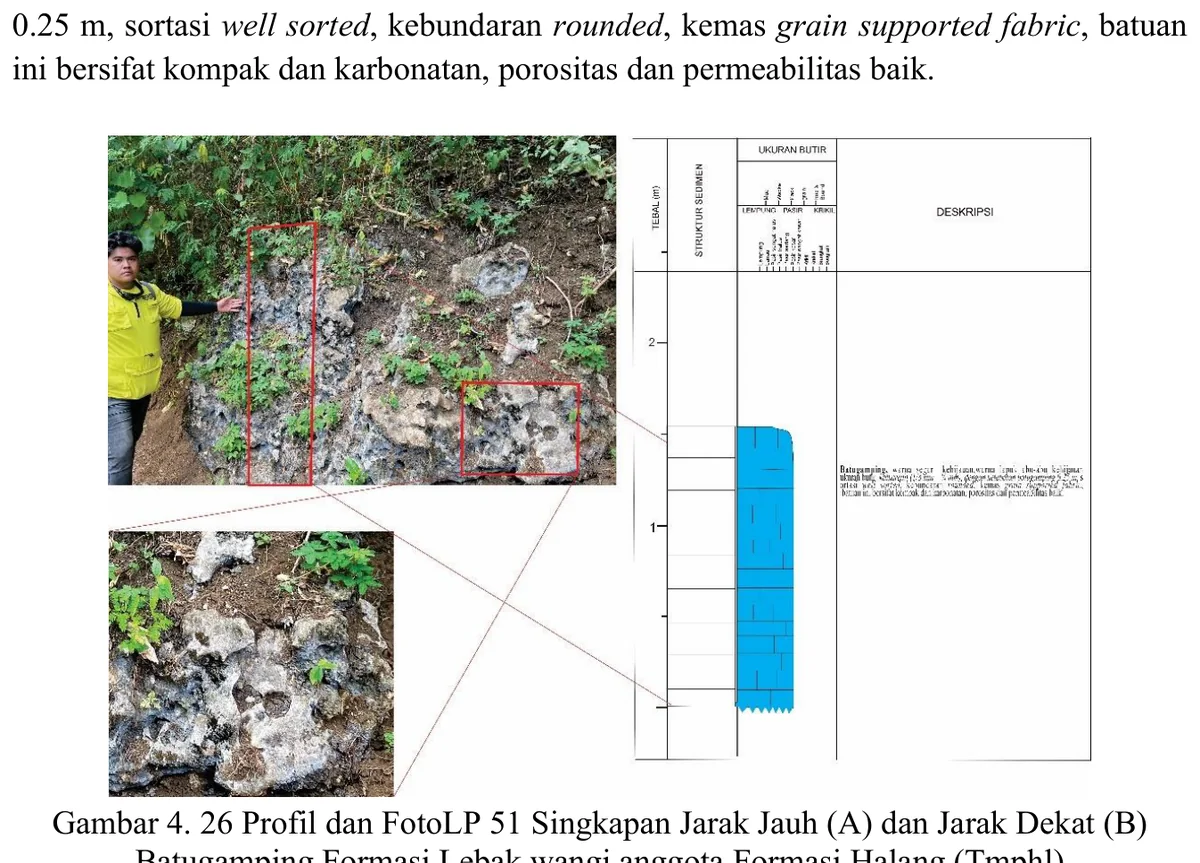
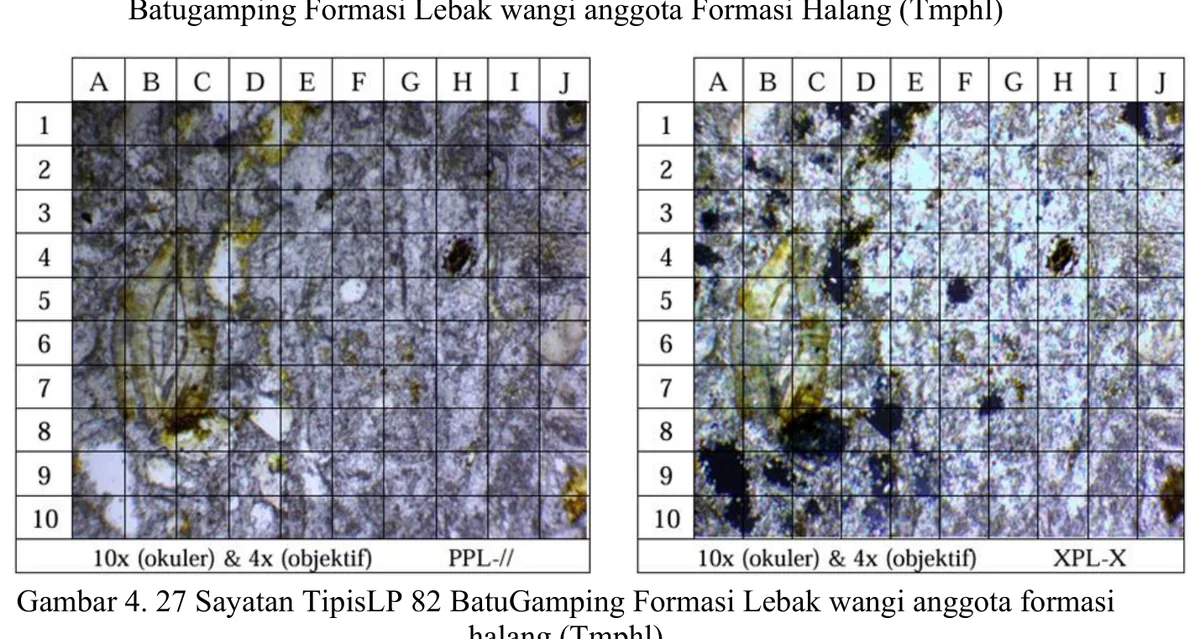
Thin section documents carbonate grains, matrix and cement.
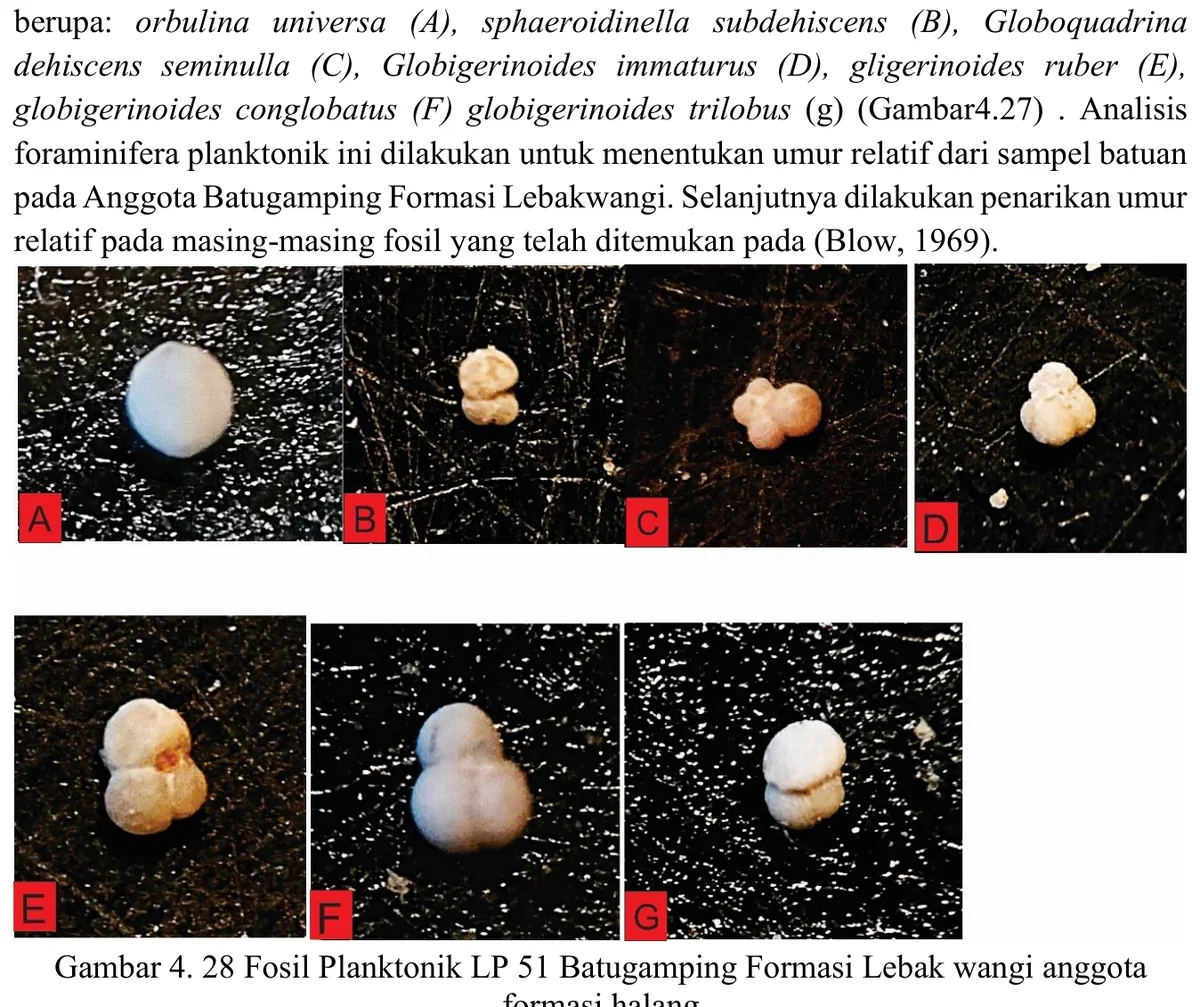
Assemblage is used to date the Lebakwangi carbonate.
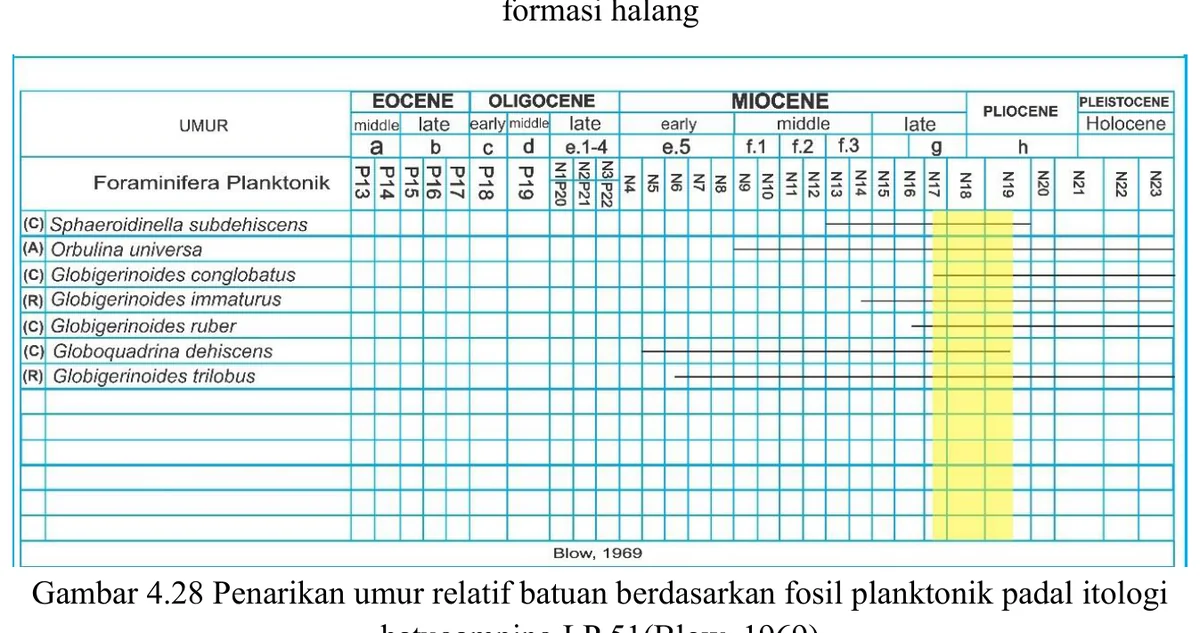
Range overlap is used to infer Late Miocene–Early Pliocene age.
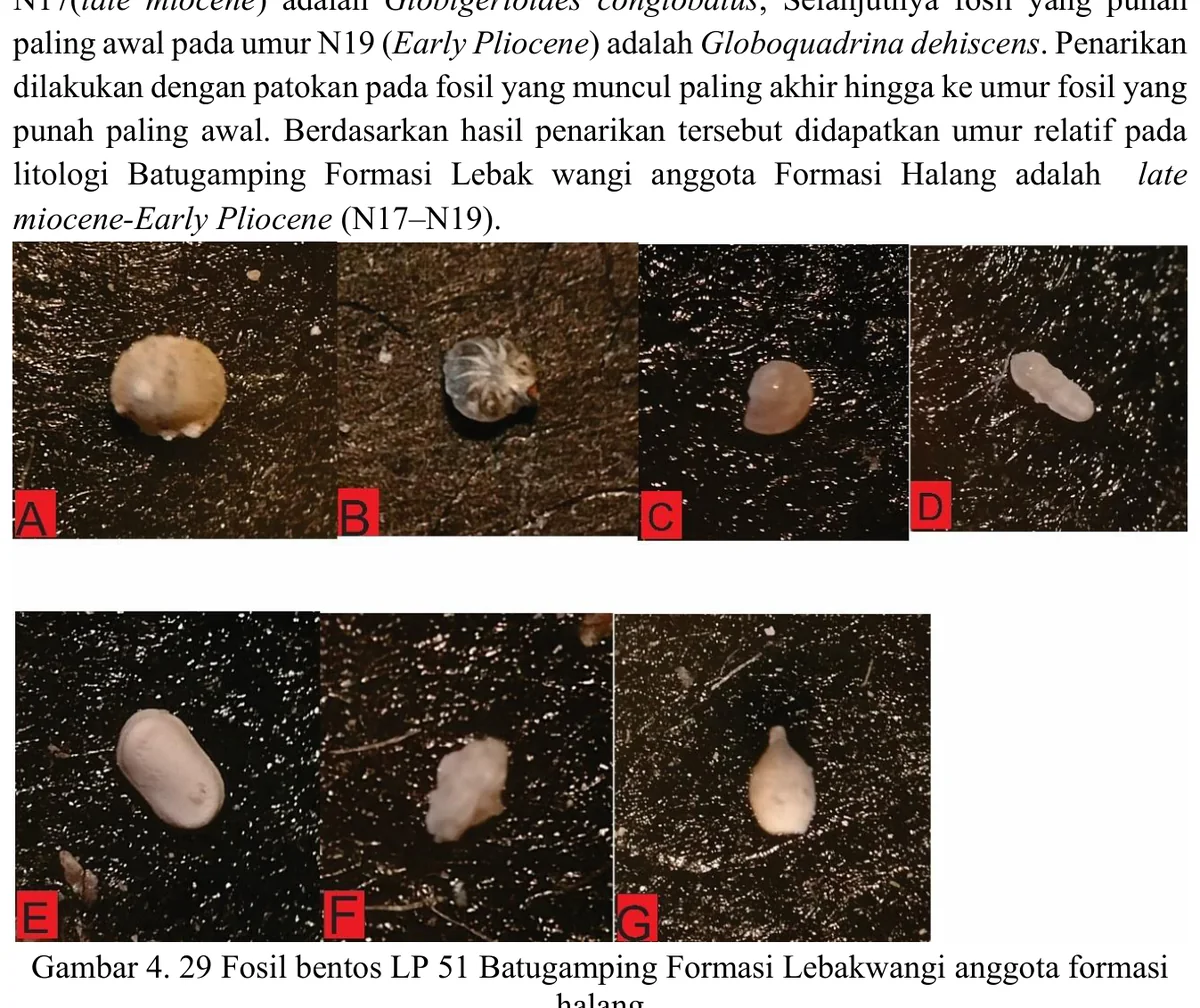
Benthic taxa are used for palaeobathymetry.
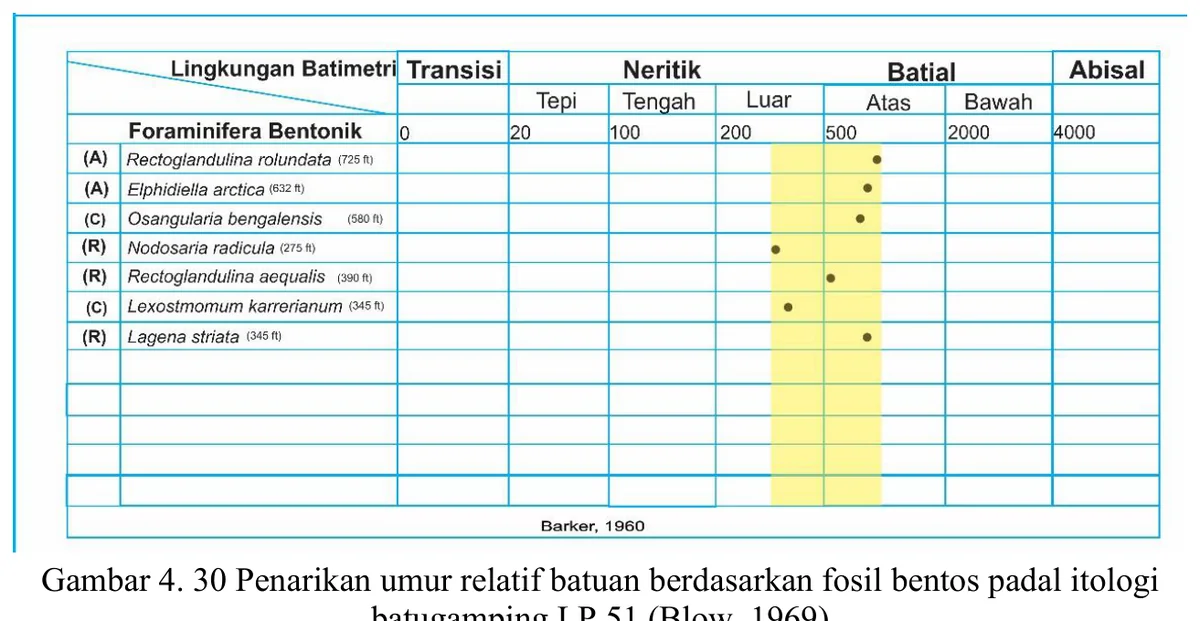
Chart combines benthic depth ranges.
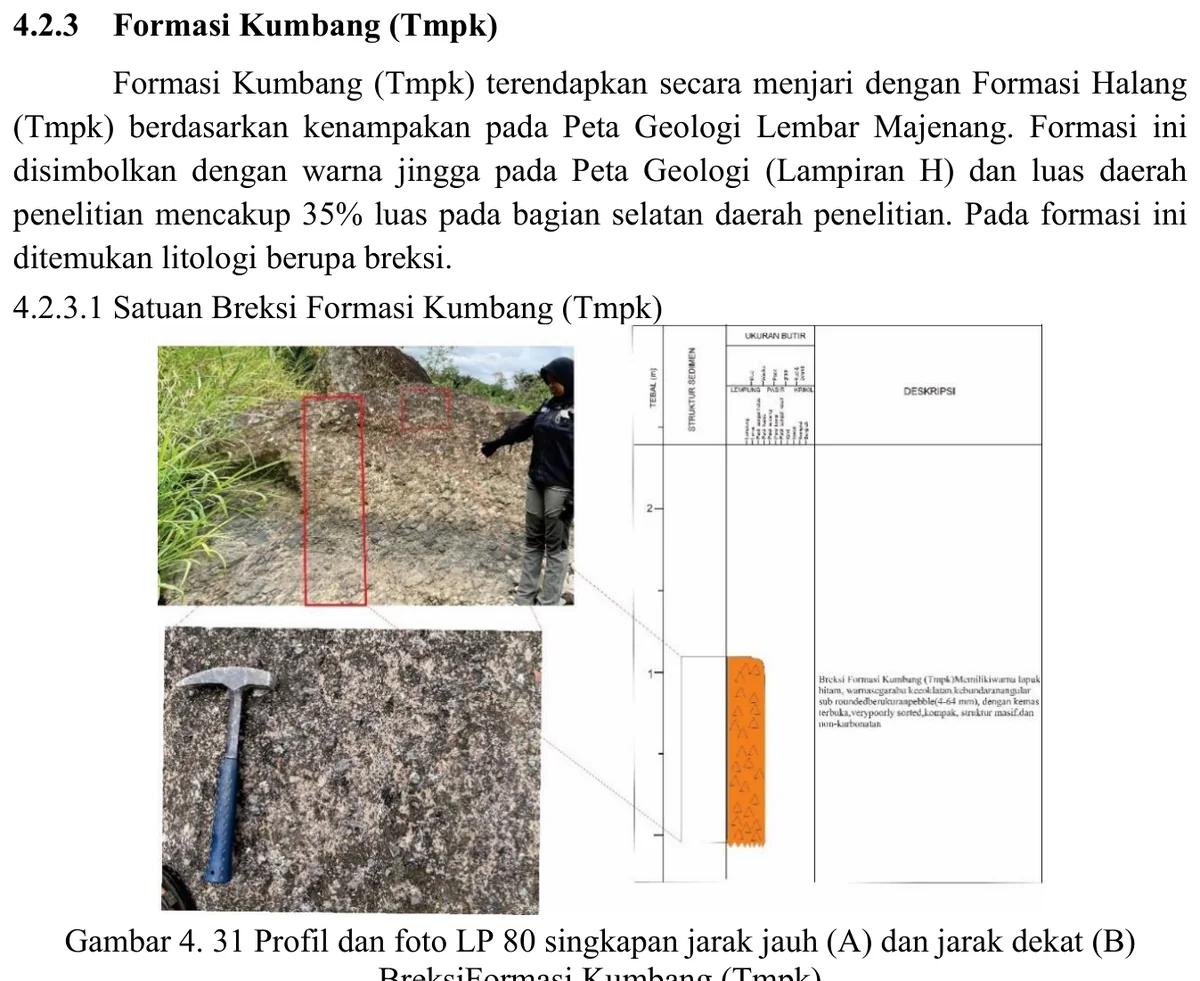
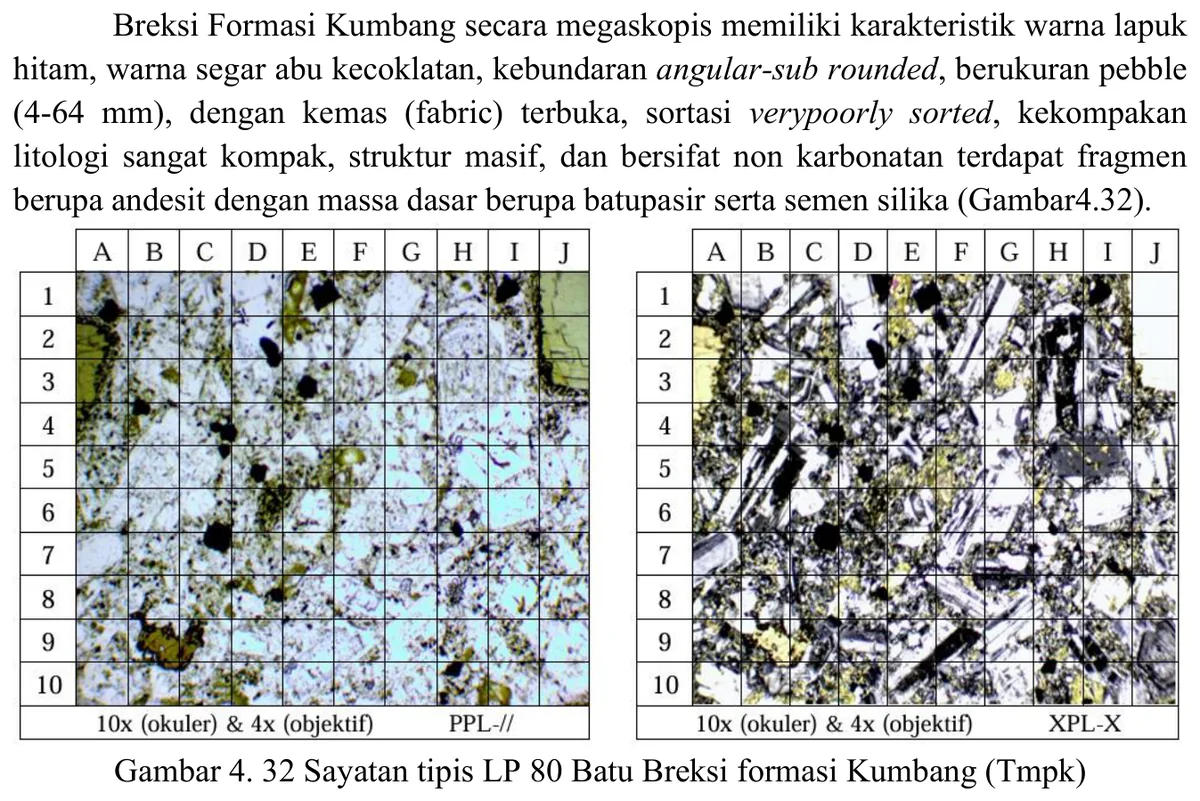
Petrography characterizes a volcanic clast within the coarse unit.
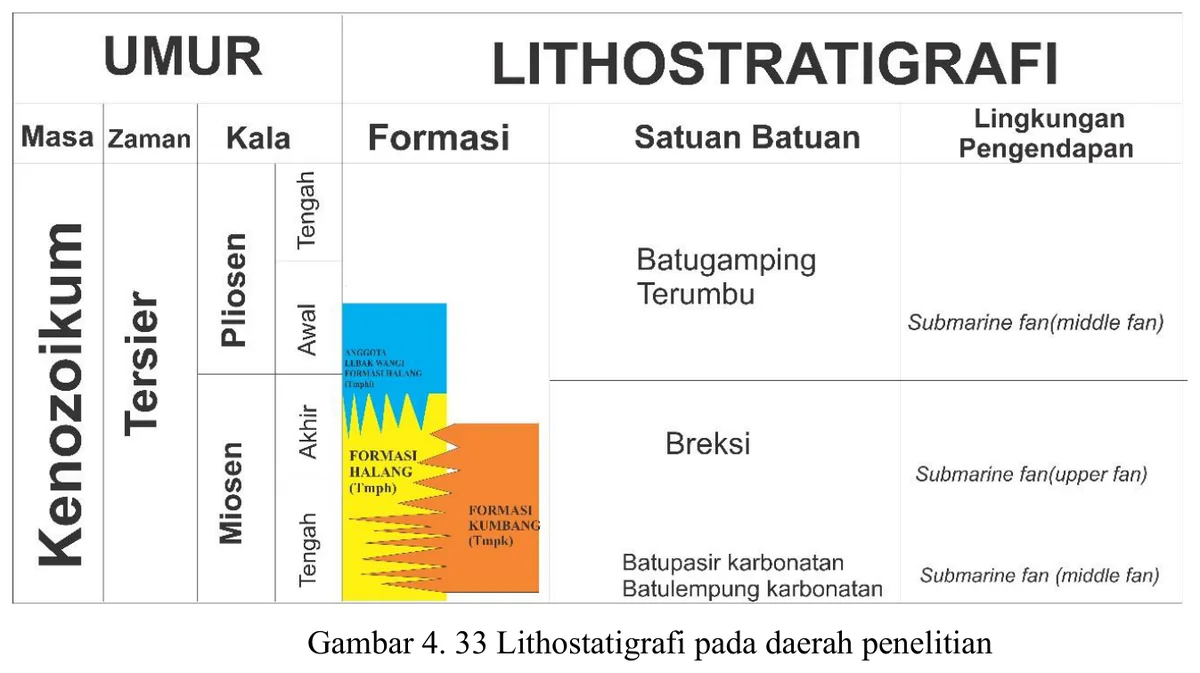
Figure summarizes the mapped units and their interpreted relationship.
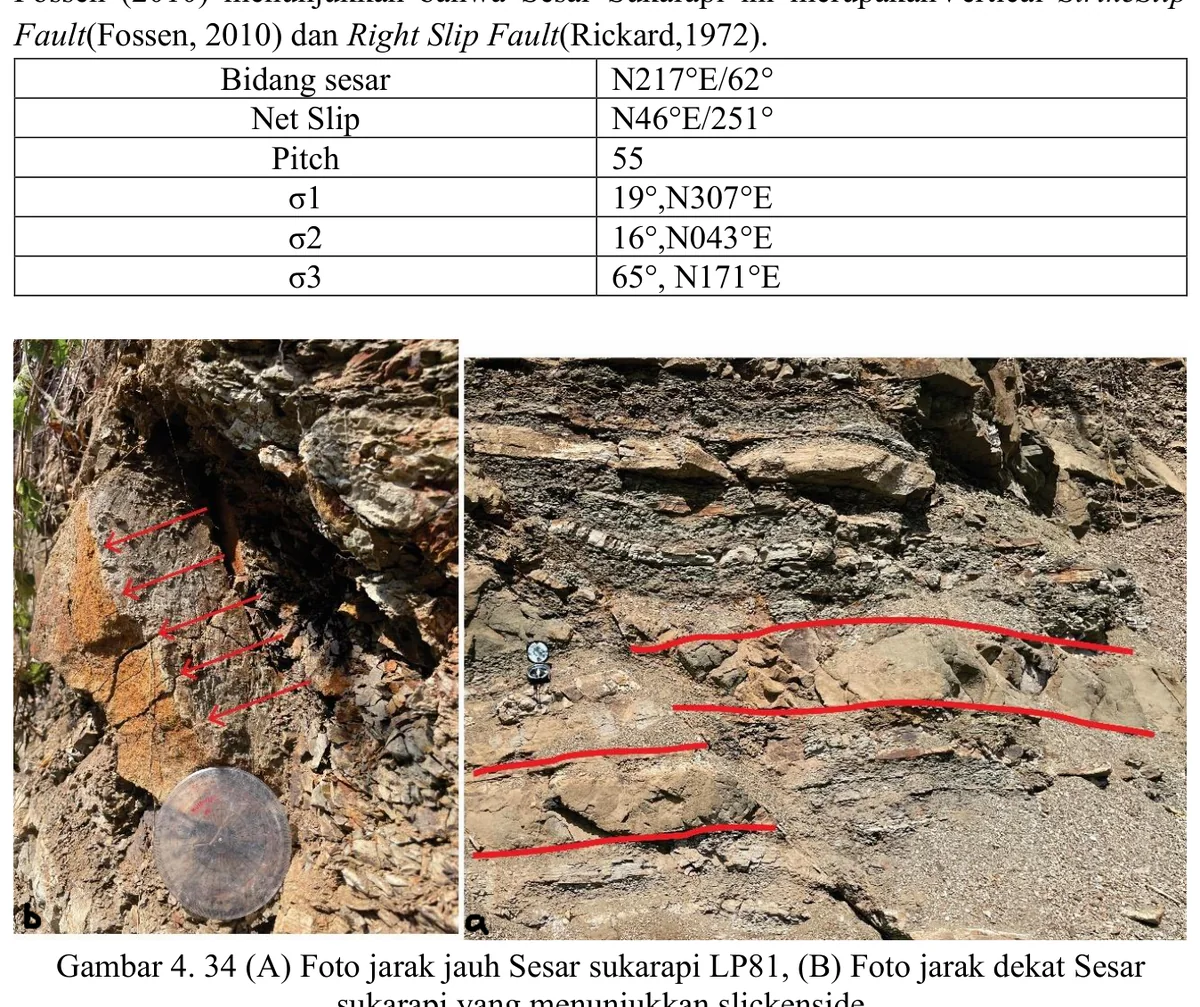
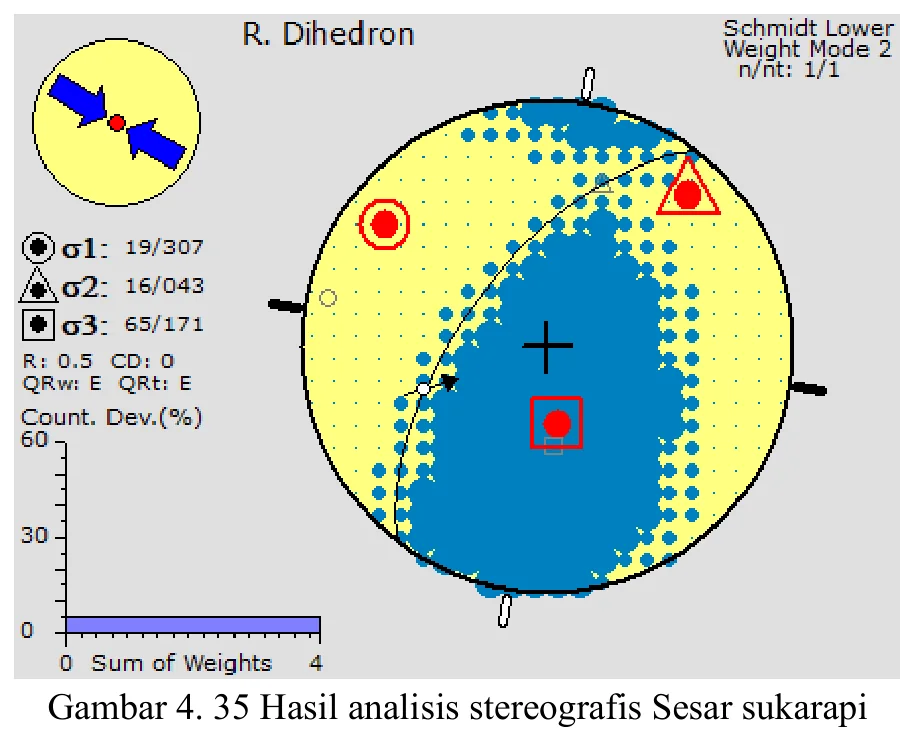
Stereonet combines fault plane, slip indicator and inferred stress orientation.
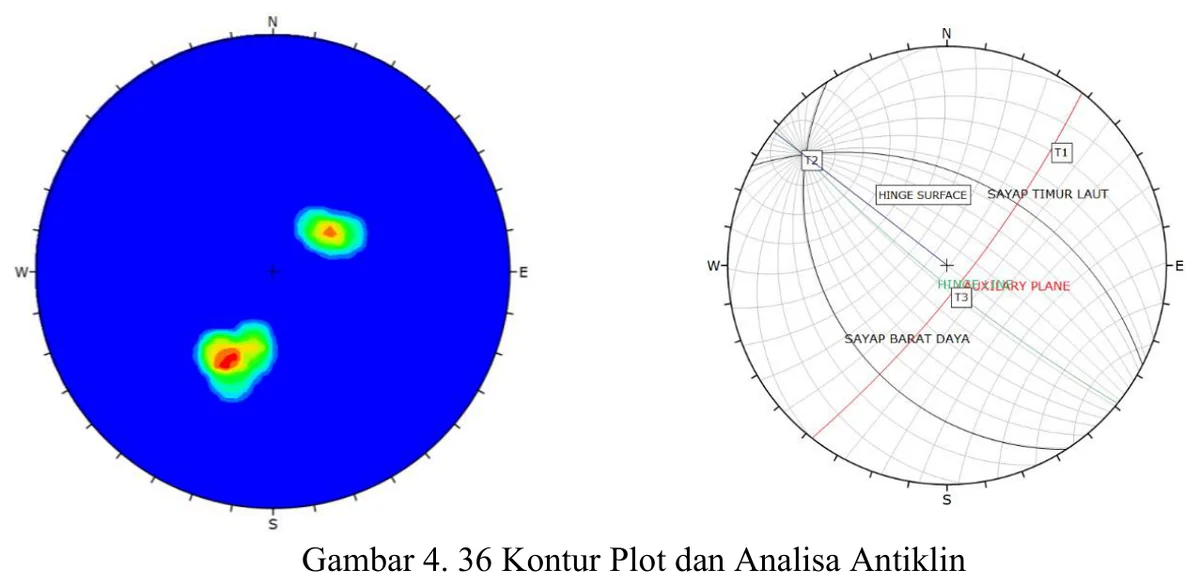
Orientation data are used to estimate fold axis and axial geometry.
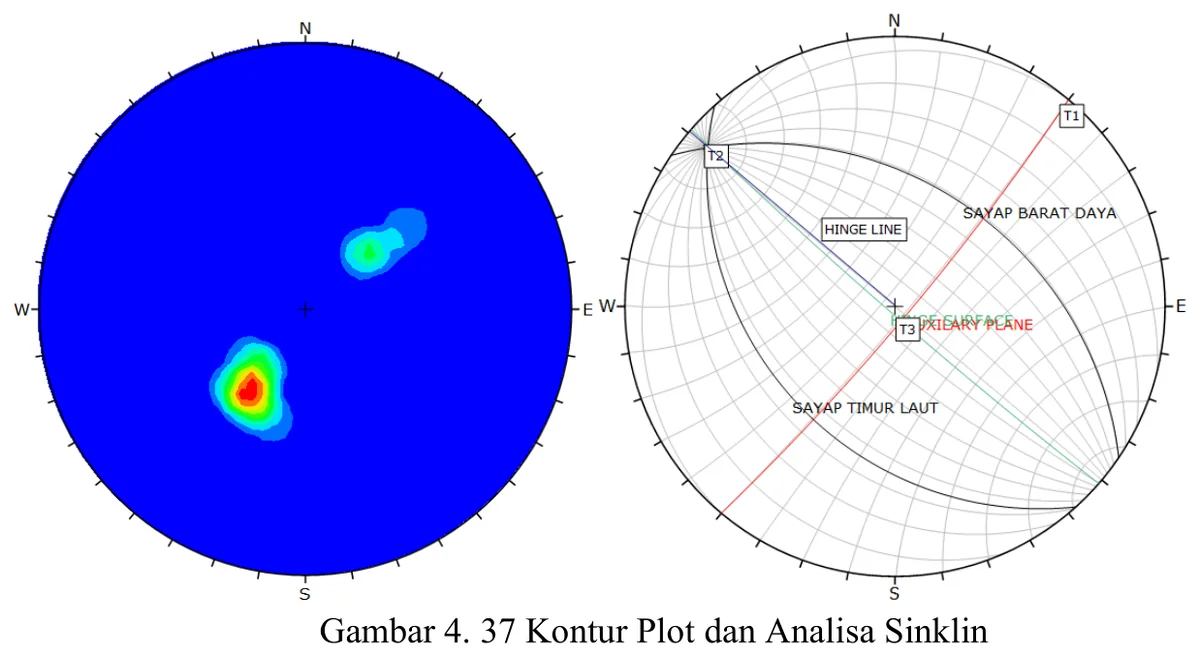
Orientation data are used to estimate the syncline axis.
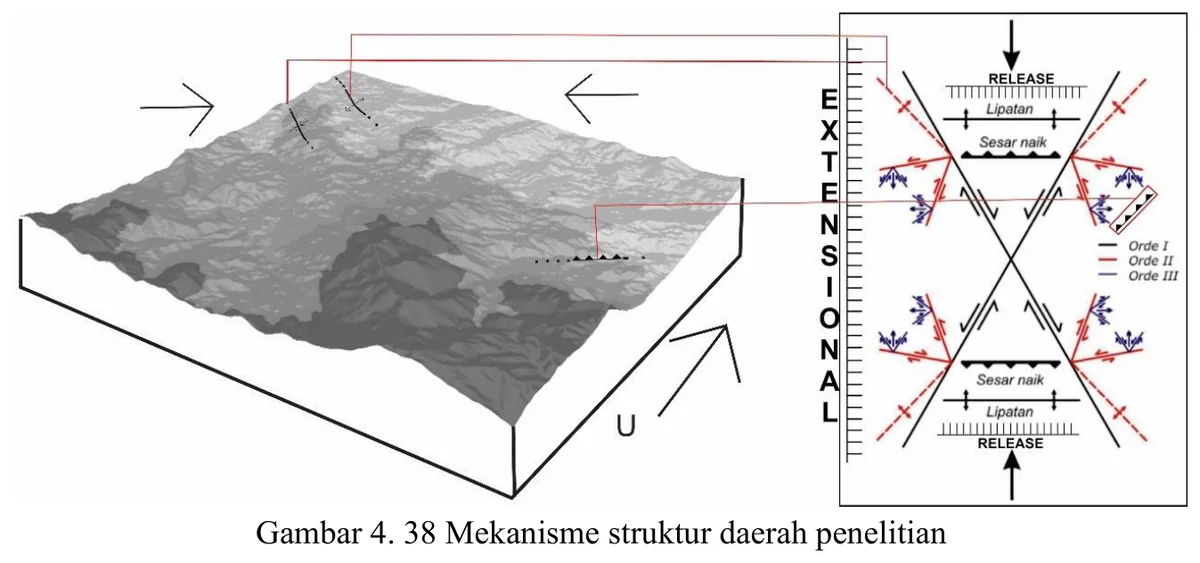
Diagram synthesizes regional compression, folds and fault development.
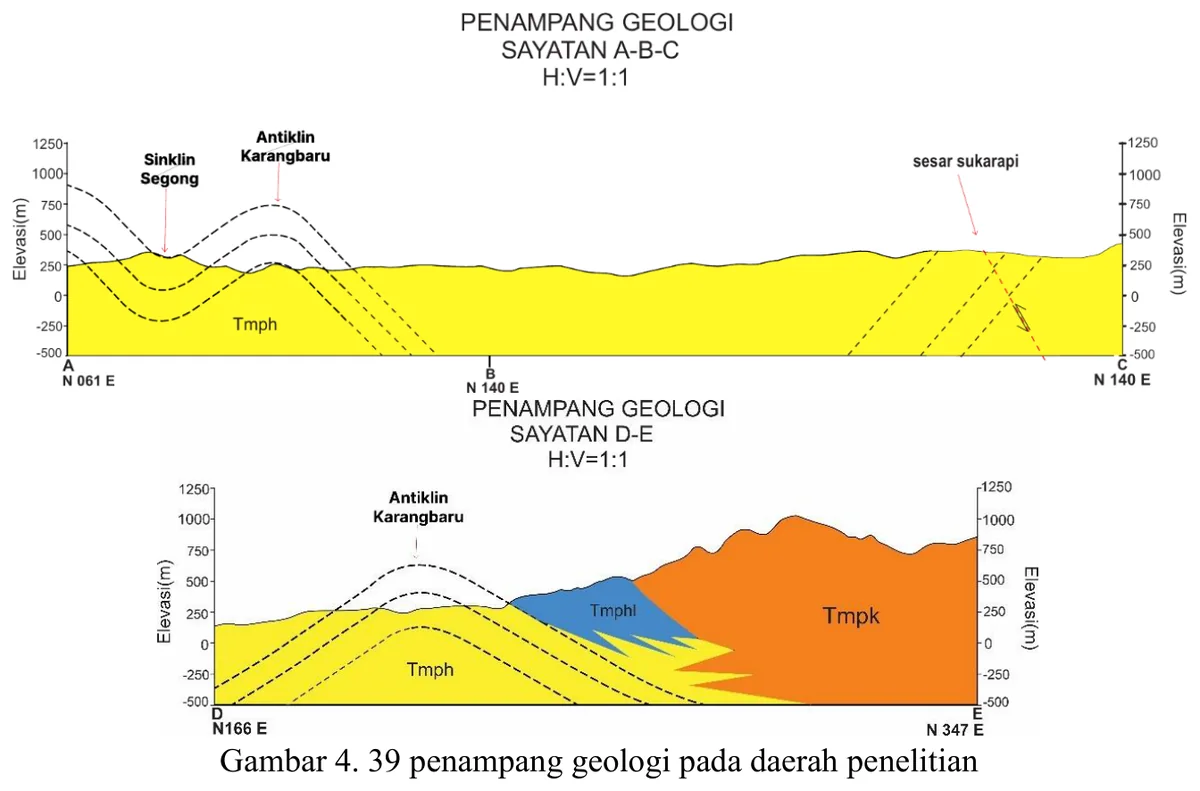
Section integrates map units, topography, bedding and structures.