thesis-4-1
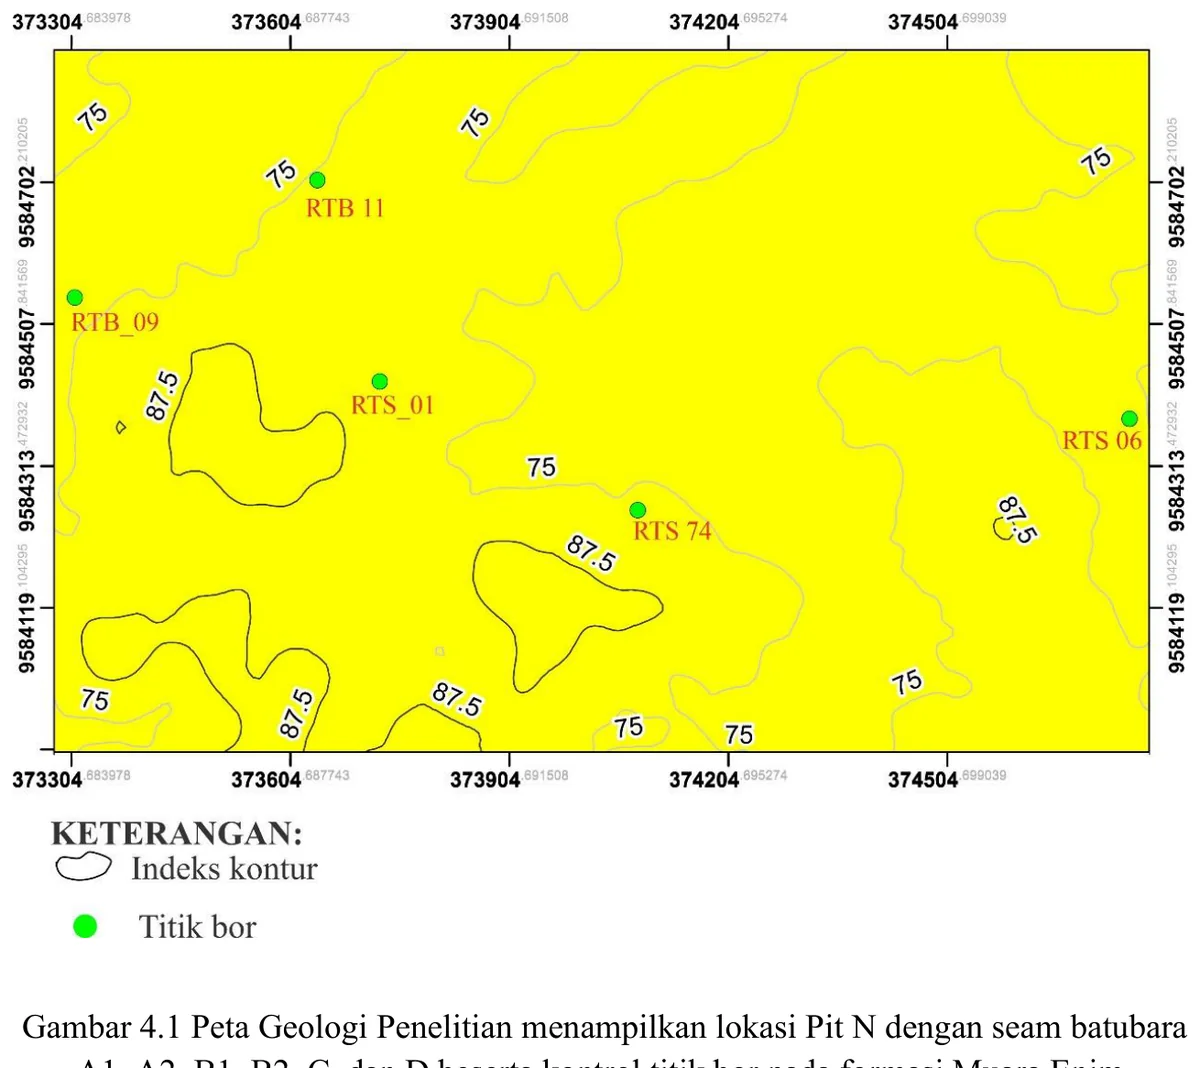
Research-area geological map and Pit N drillhole control
The map locates the research area and boreholes that constrain the geological interpretation.
ALBUM
All 51 records are shown below.
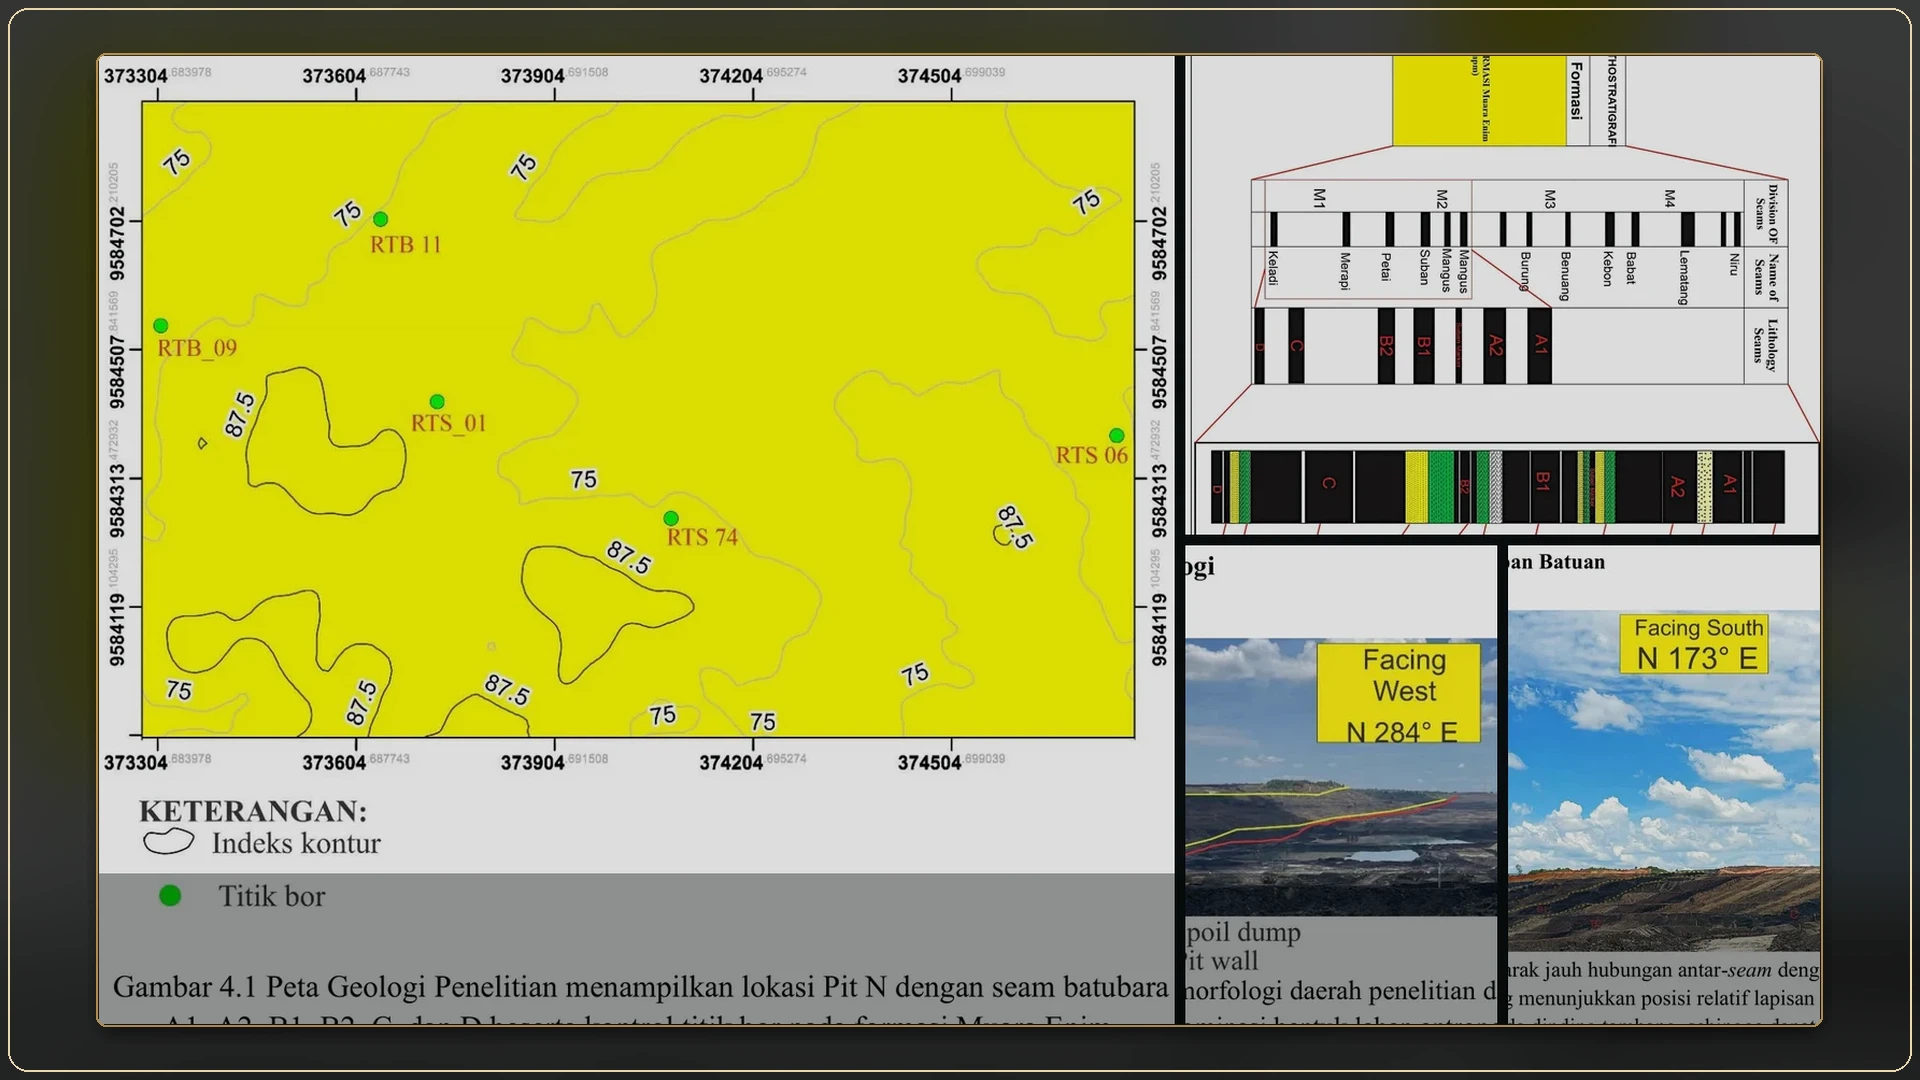
The map locates the research area and boreholes that constrain the geological interpretation.
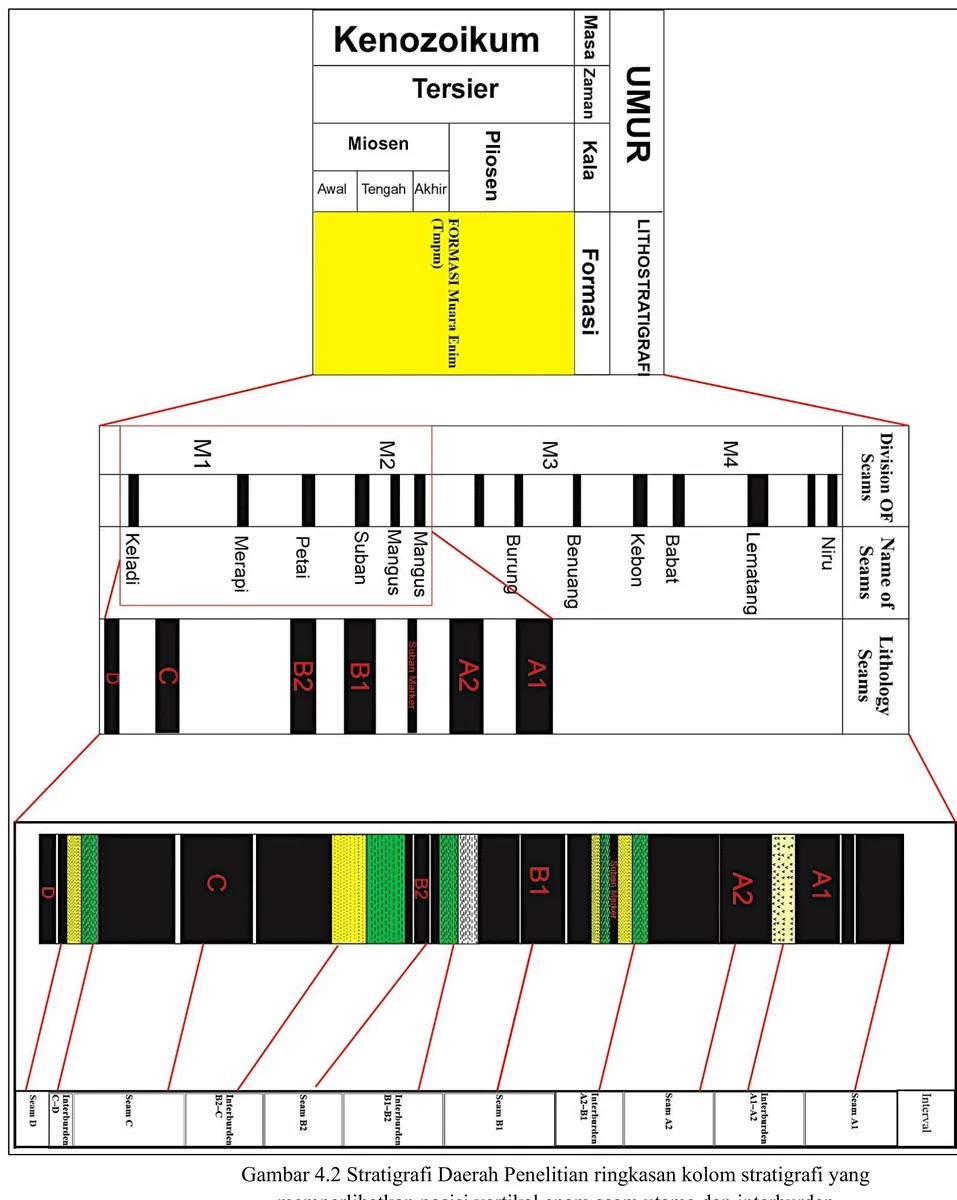
The figure summarizes the vertical order and correlation of the principal lithologic and coal intervals.
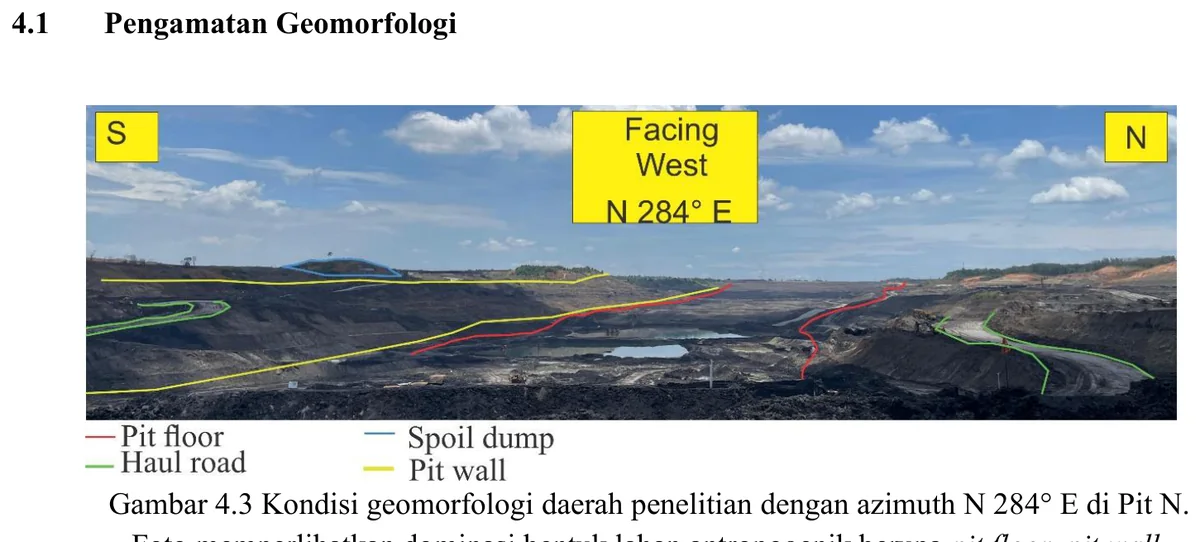
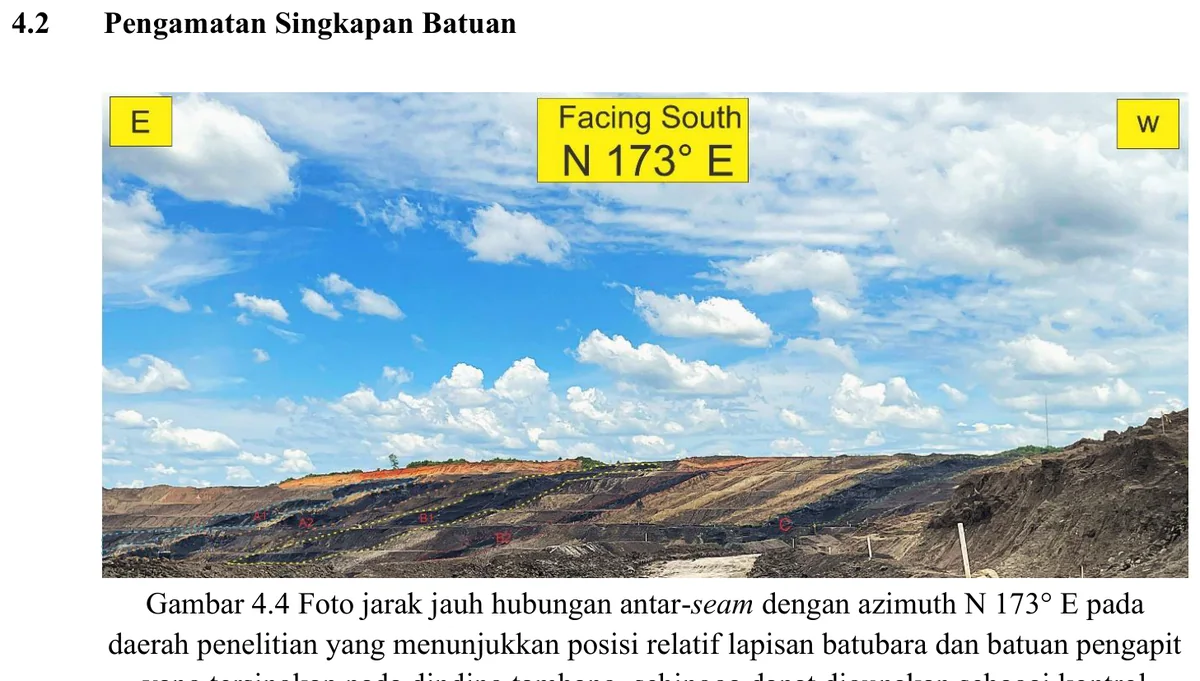
The figure records the terrain setting surrounding the coal-bearing succession.
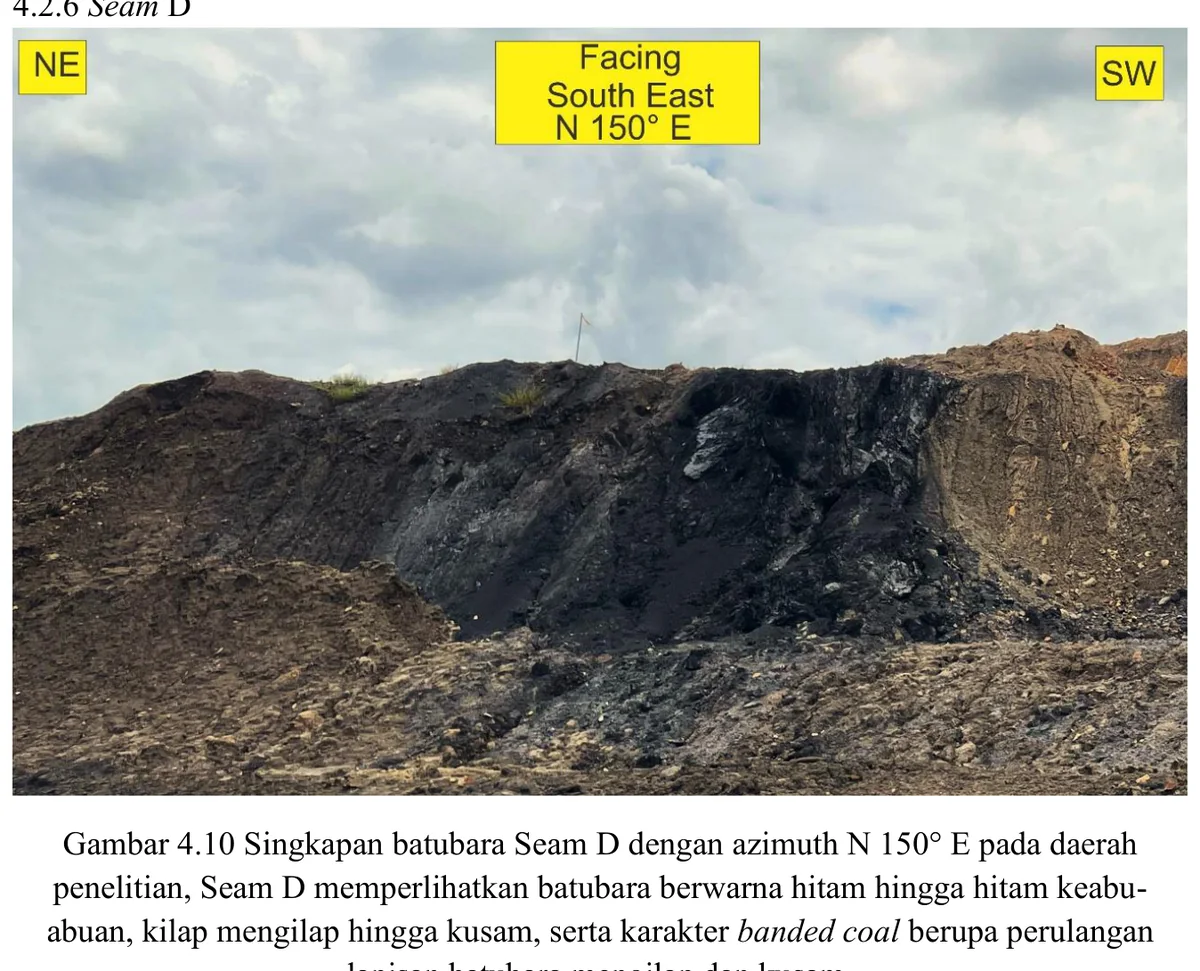
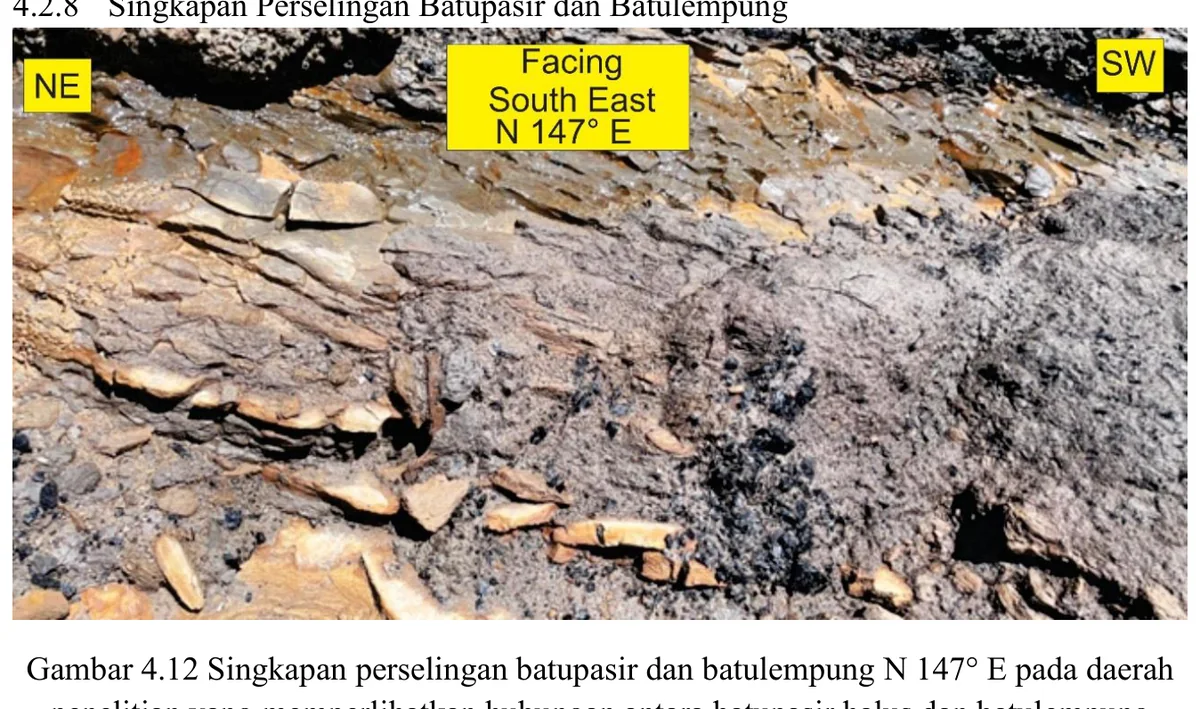
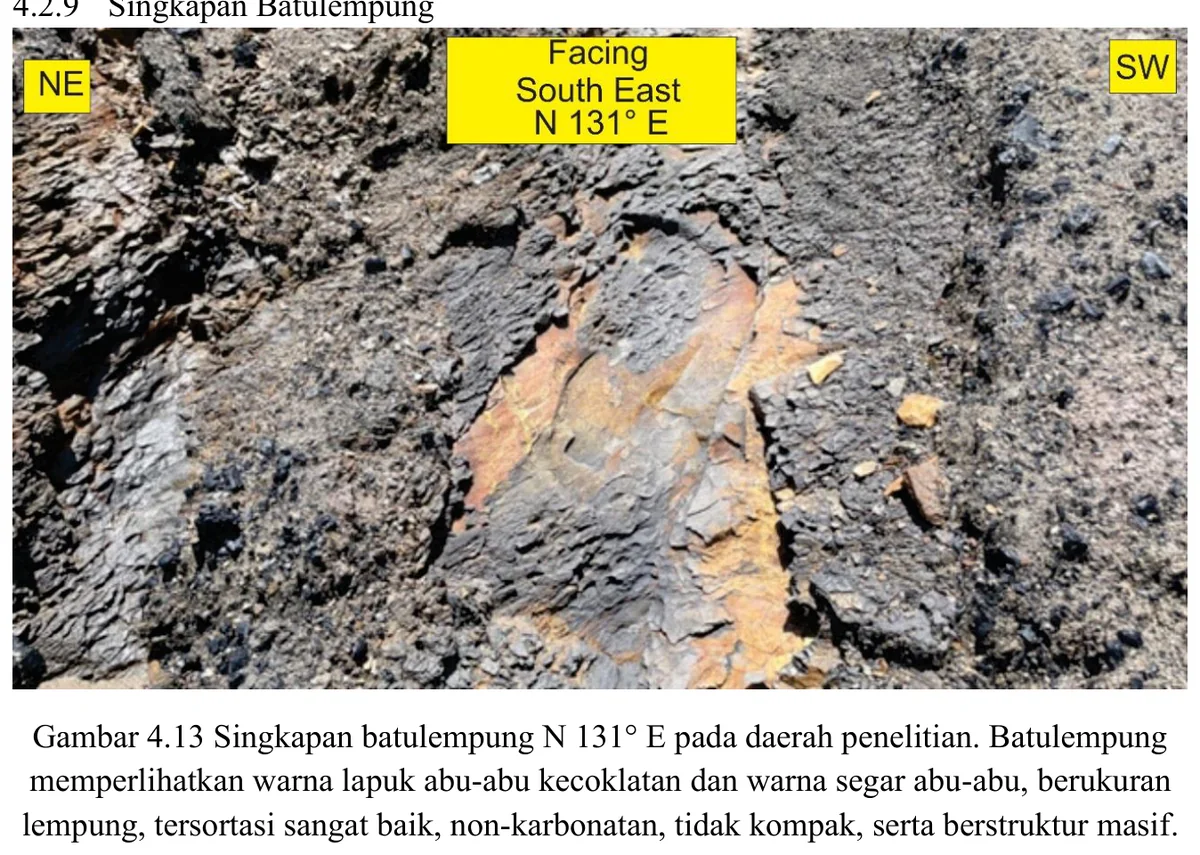
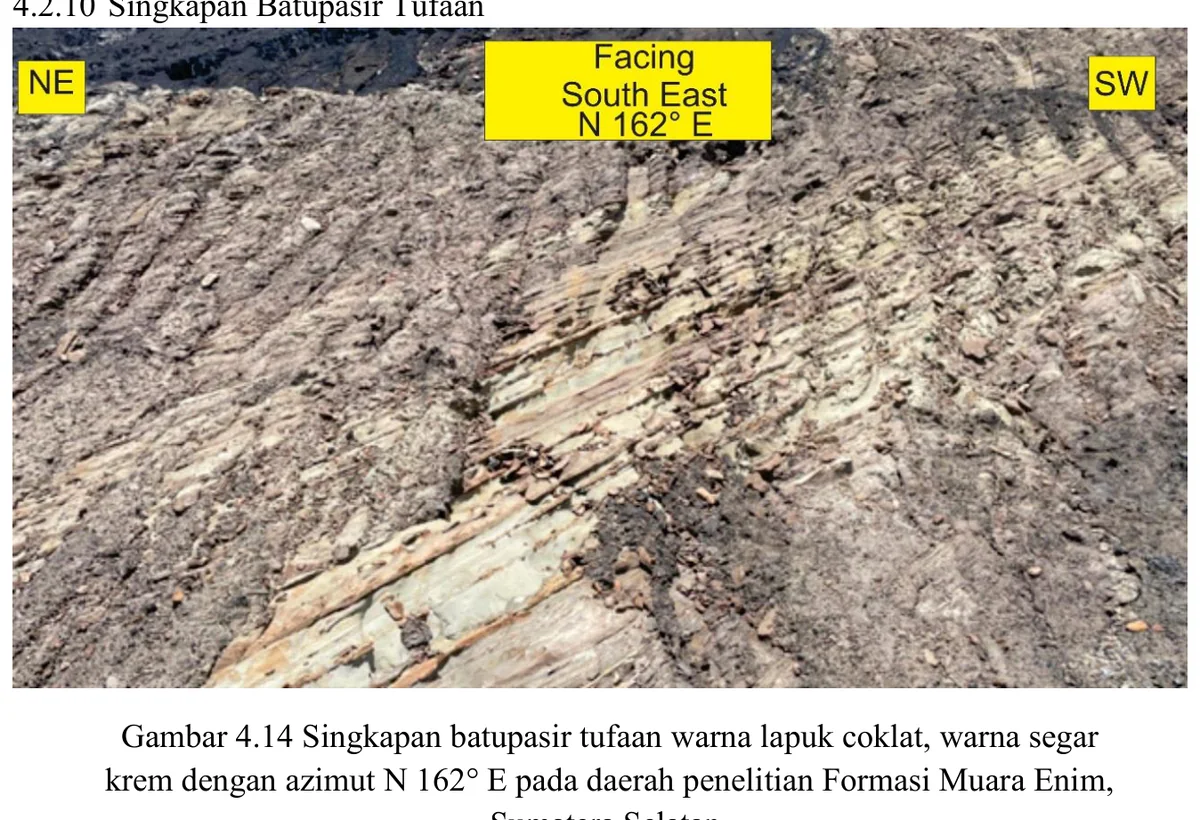
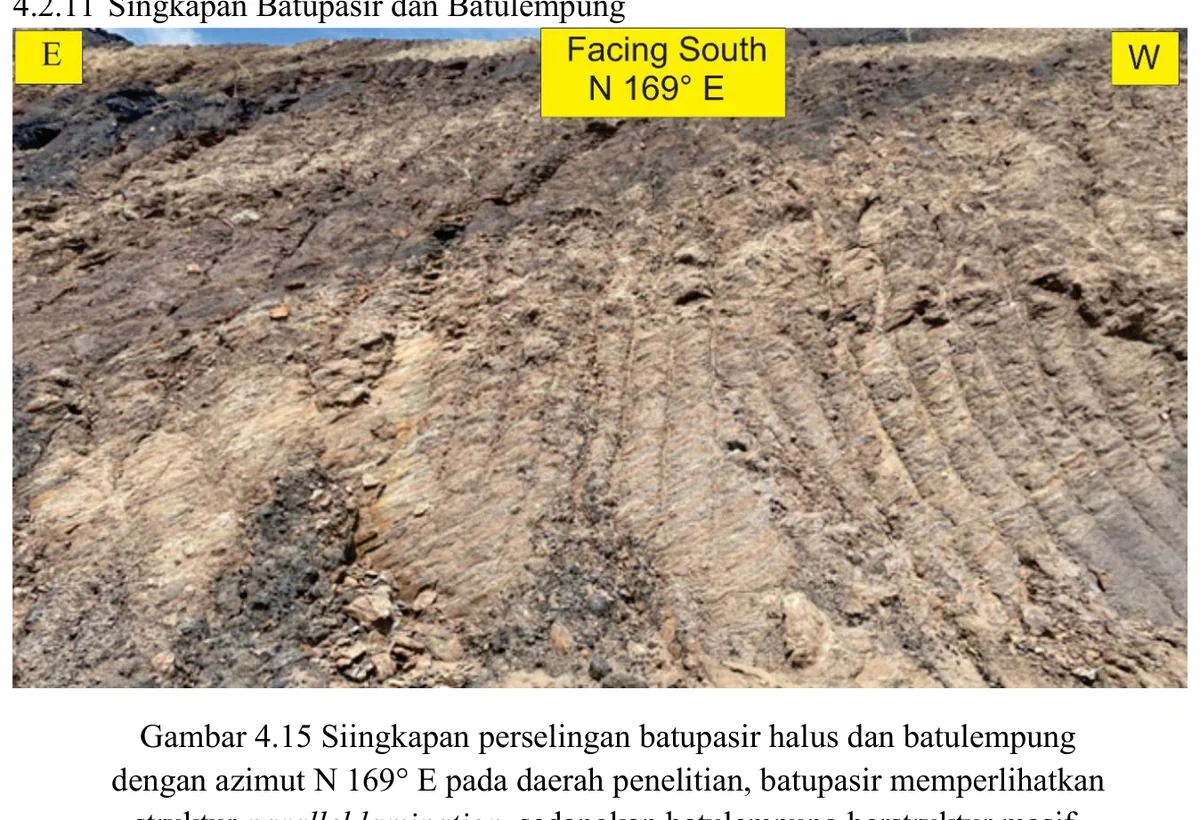
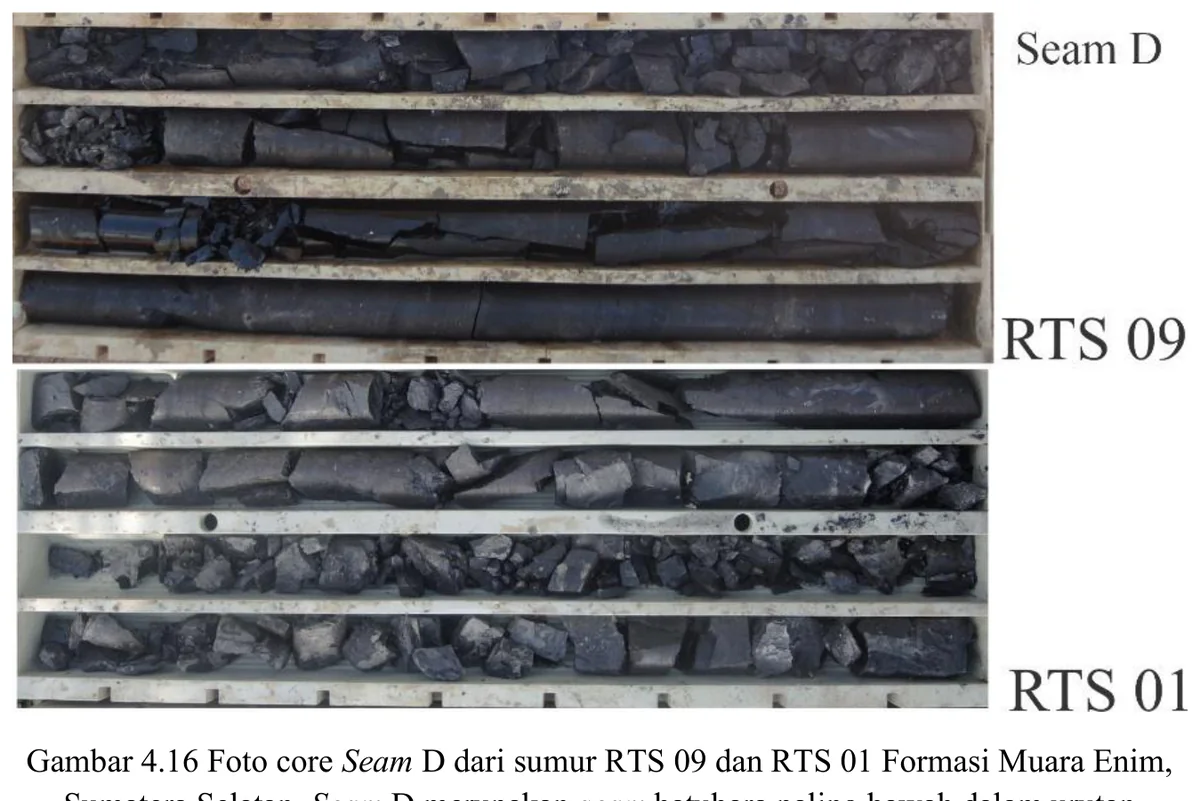
The core panel records the vertical lithologic succession through Seam D.
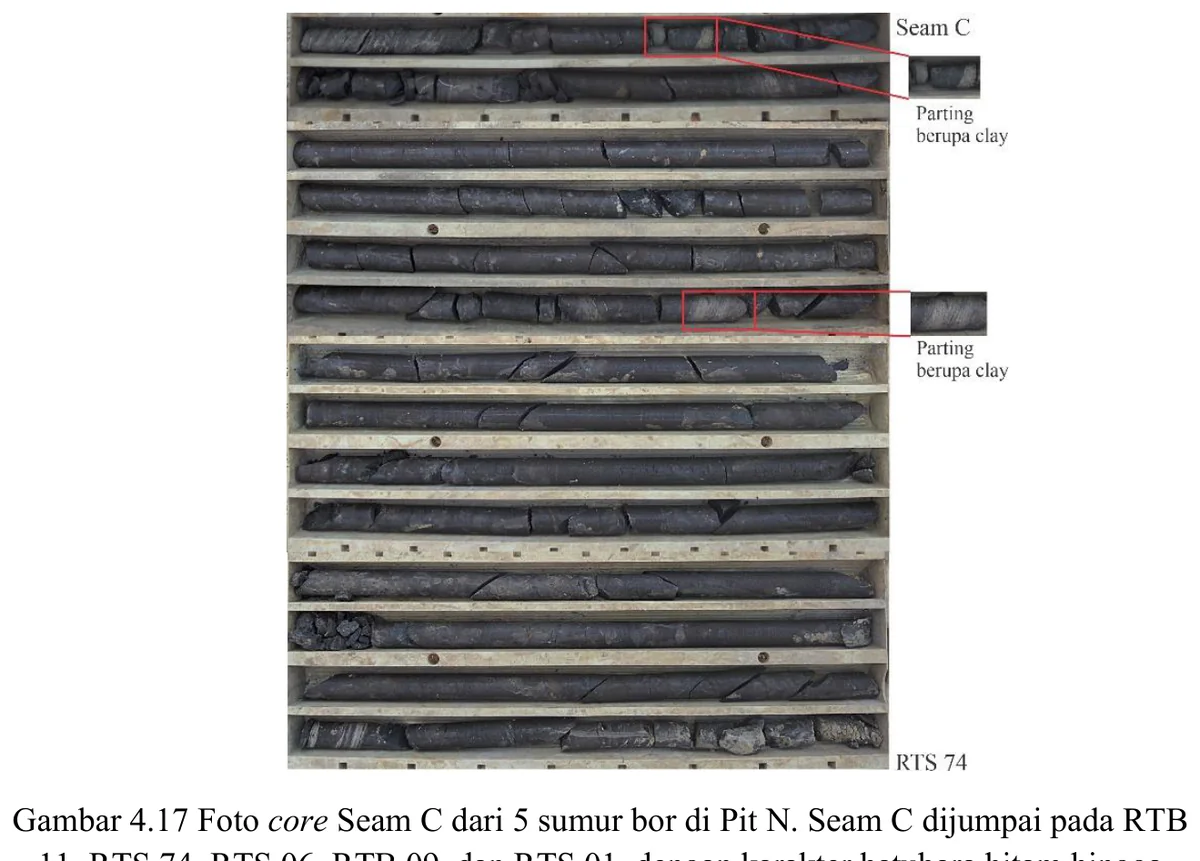
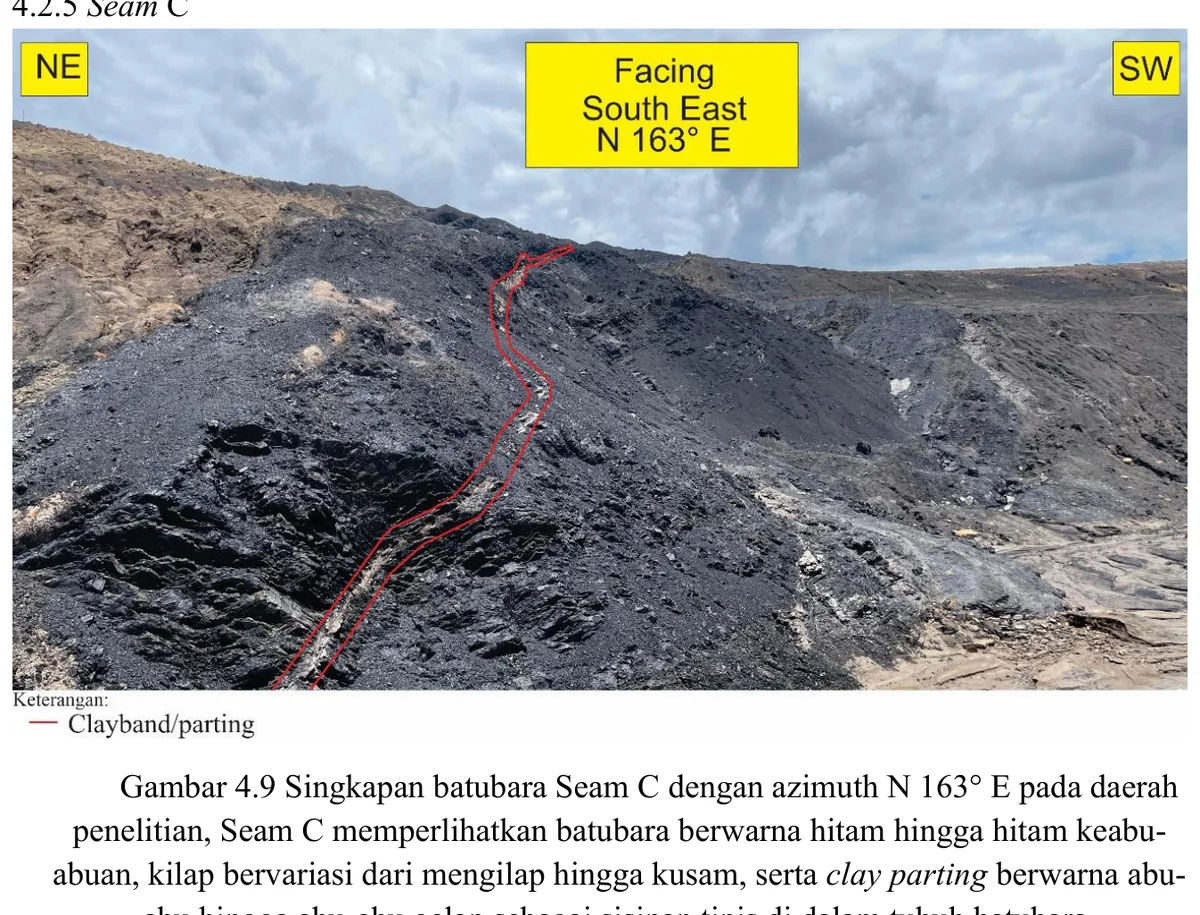
The core panel records the vertical lithologic succession through Seam C.
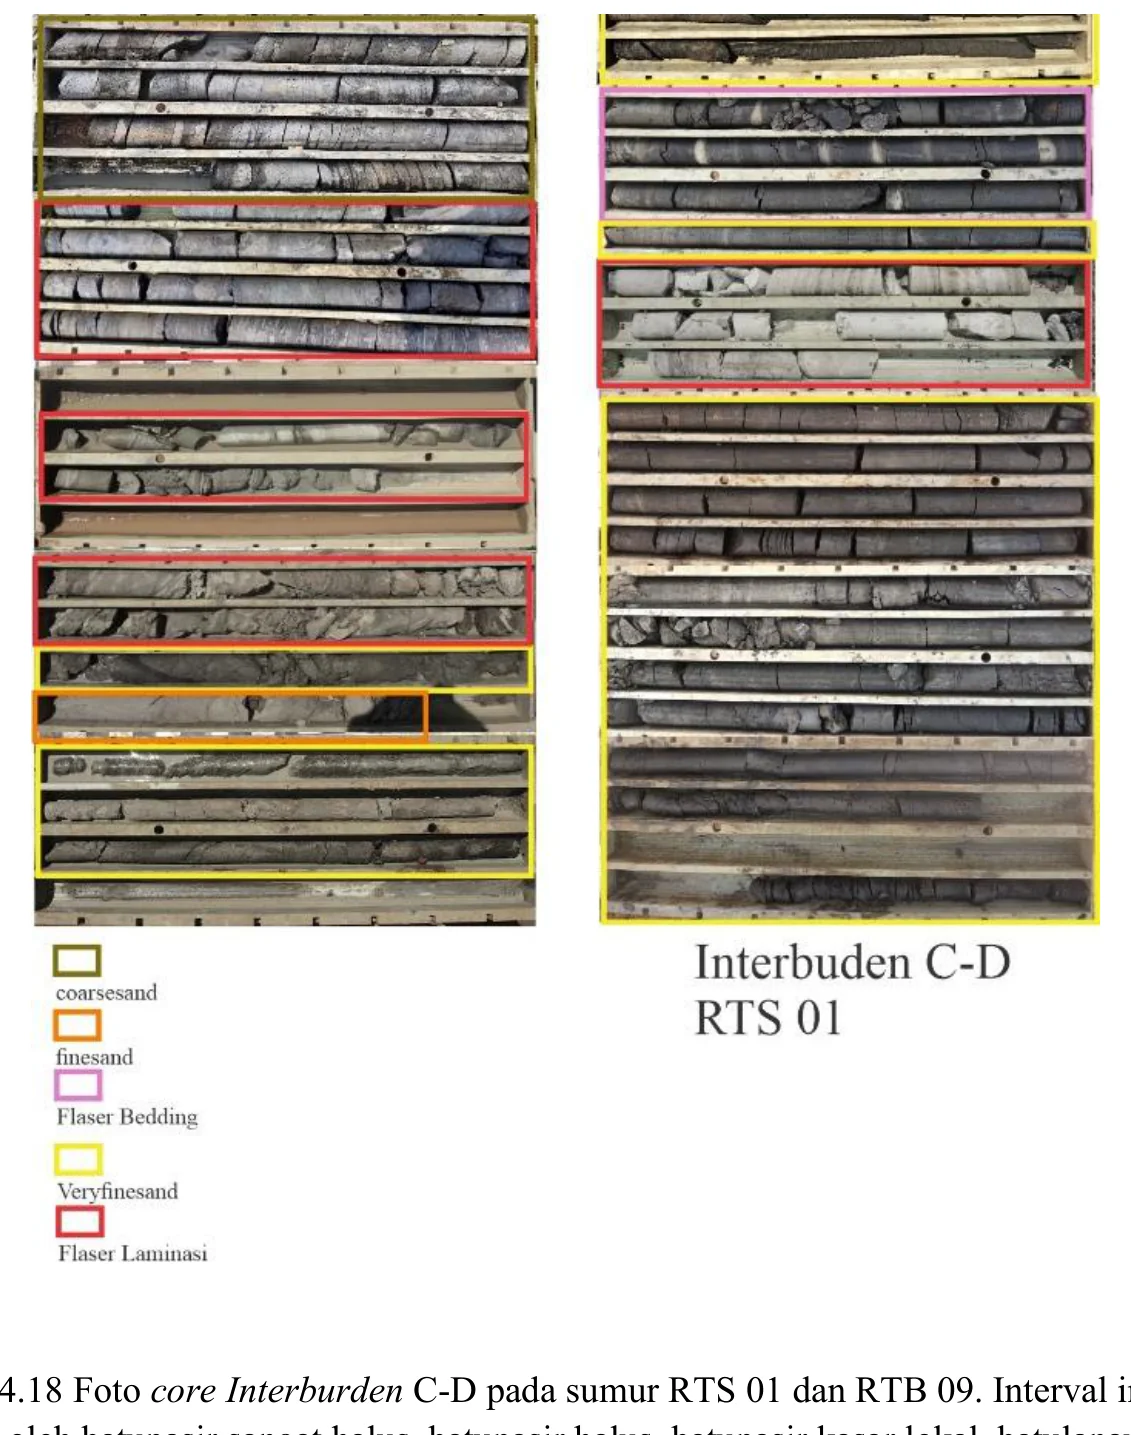
The core panel records the vertical lithologic succession through C–D interburden.
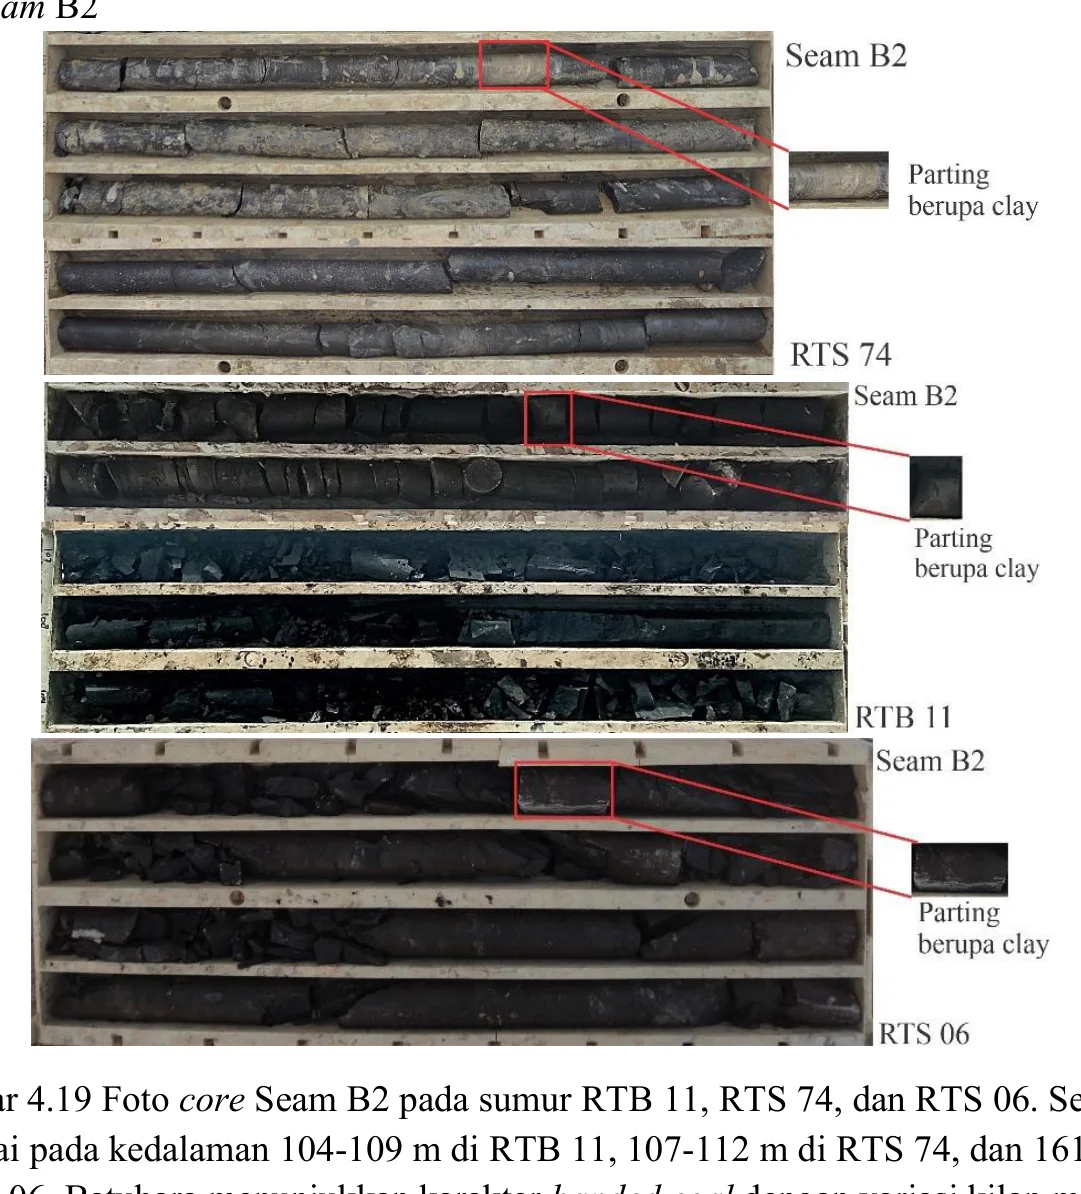
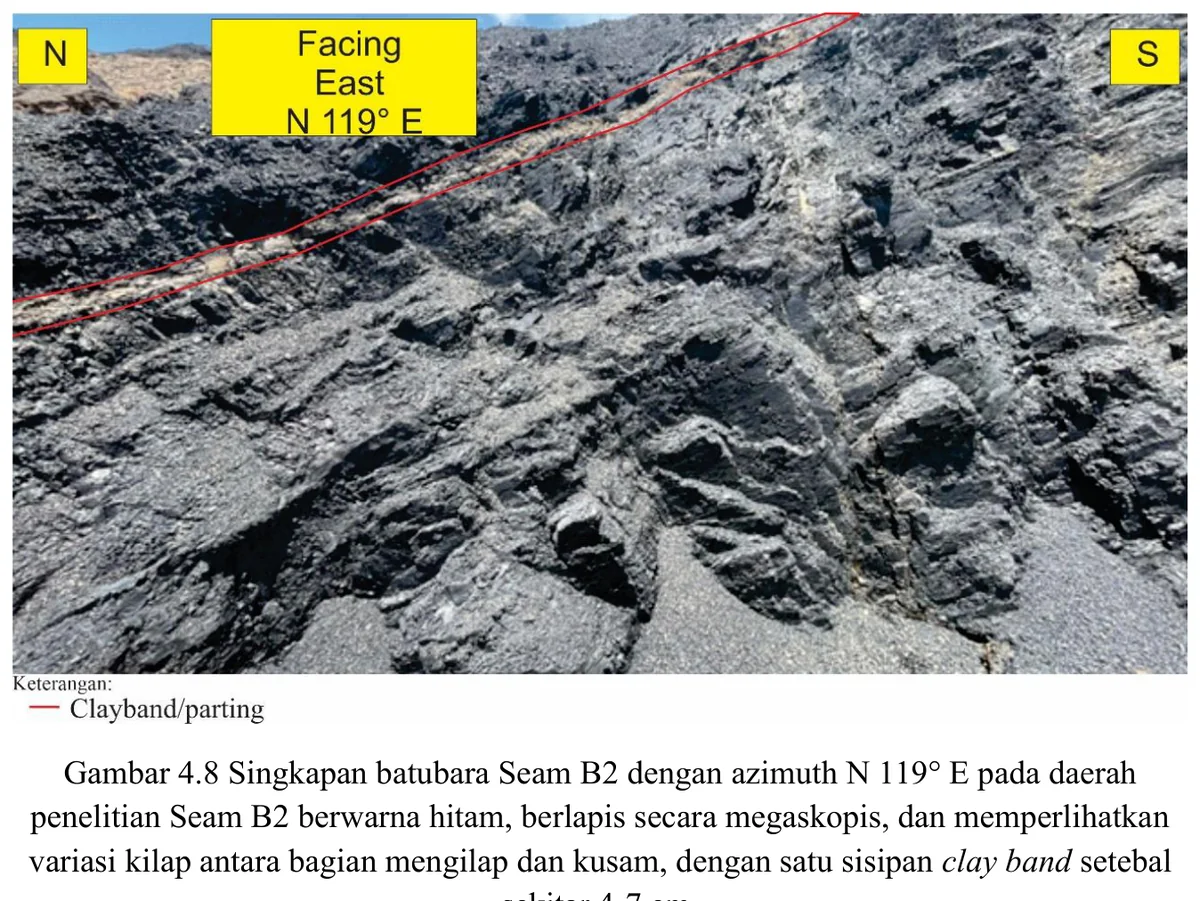
The core panel records the vertical lithologic succession through Seam B2.
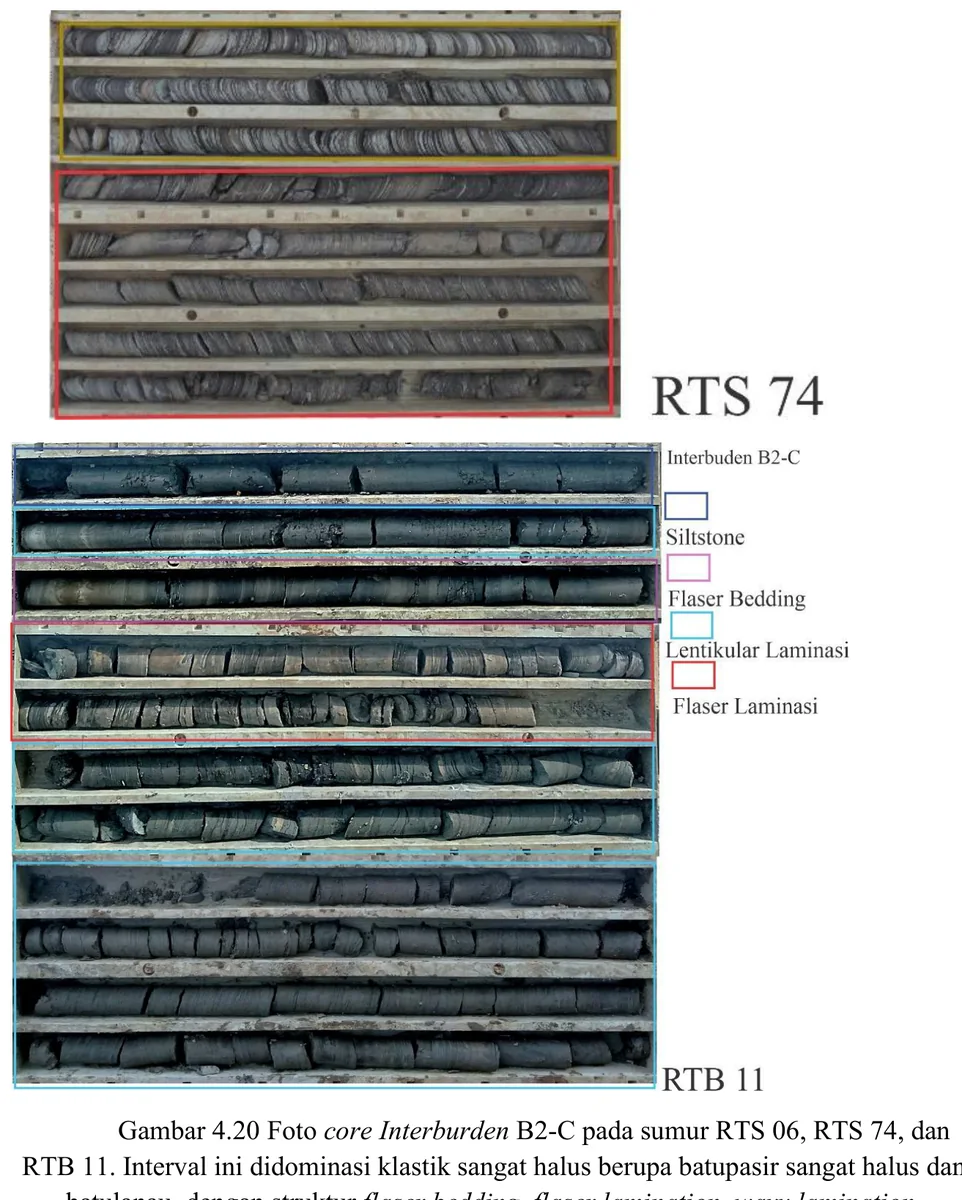
The core panel records the vertical lithologic succession through B2–C interburden.
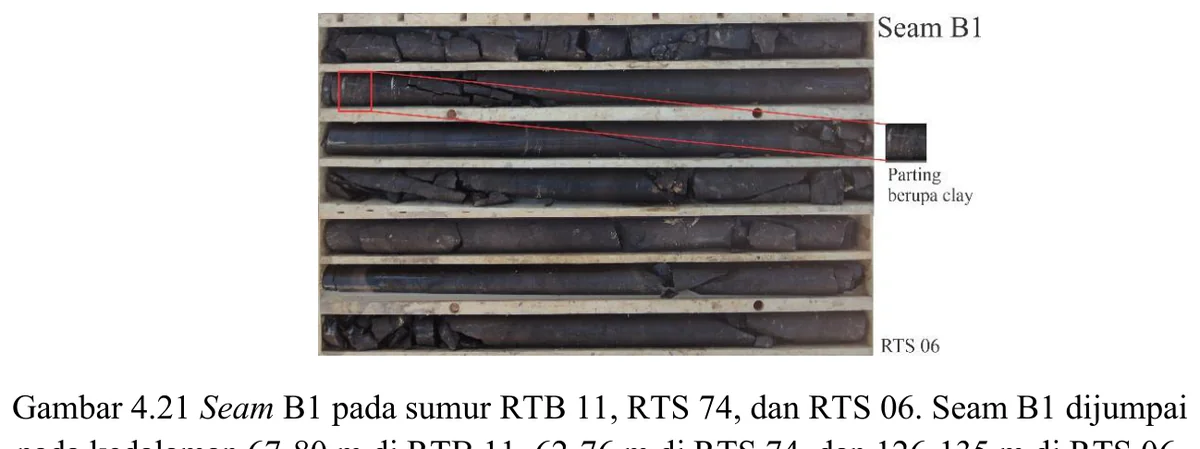
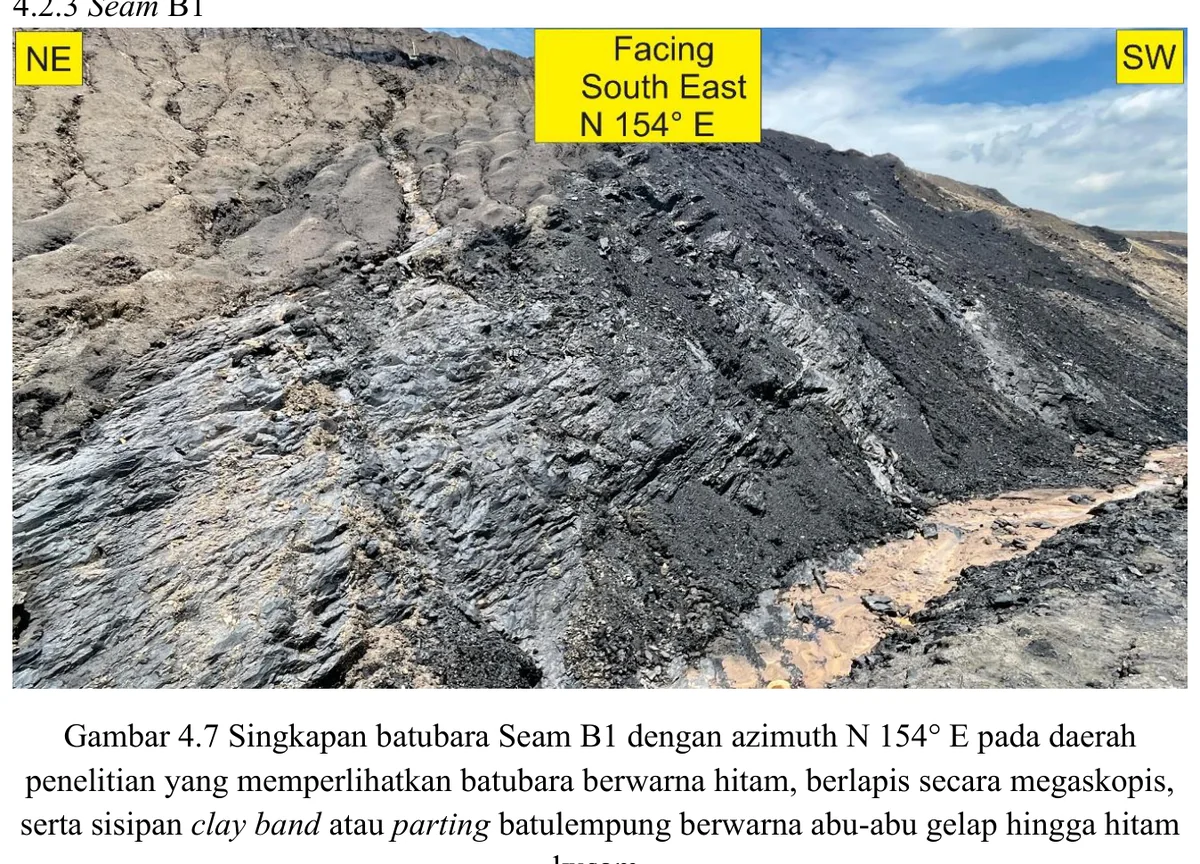
The core panel records the vertical lithologic succession through Seam B1.
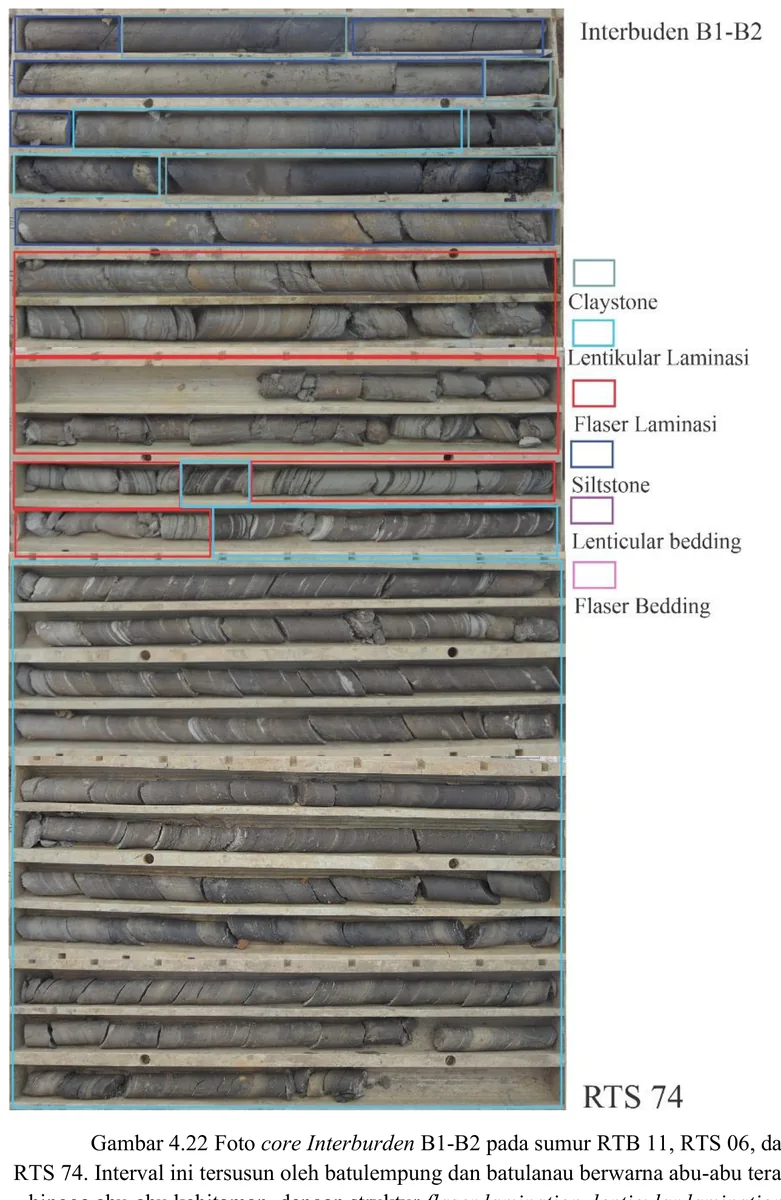
The core panel records the vertical lithologic succession through B1–B2 interburden.
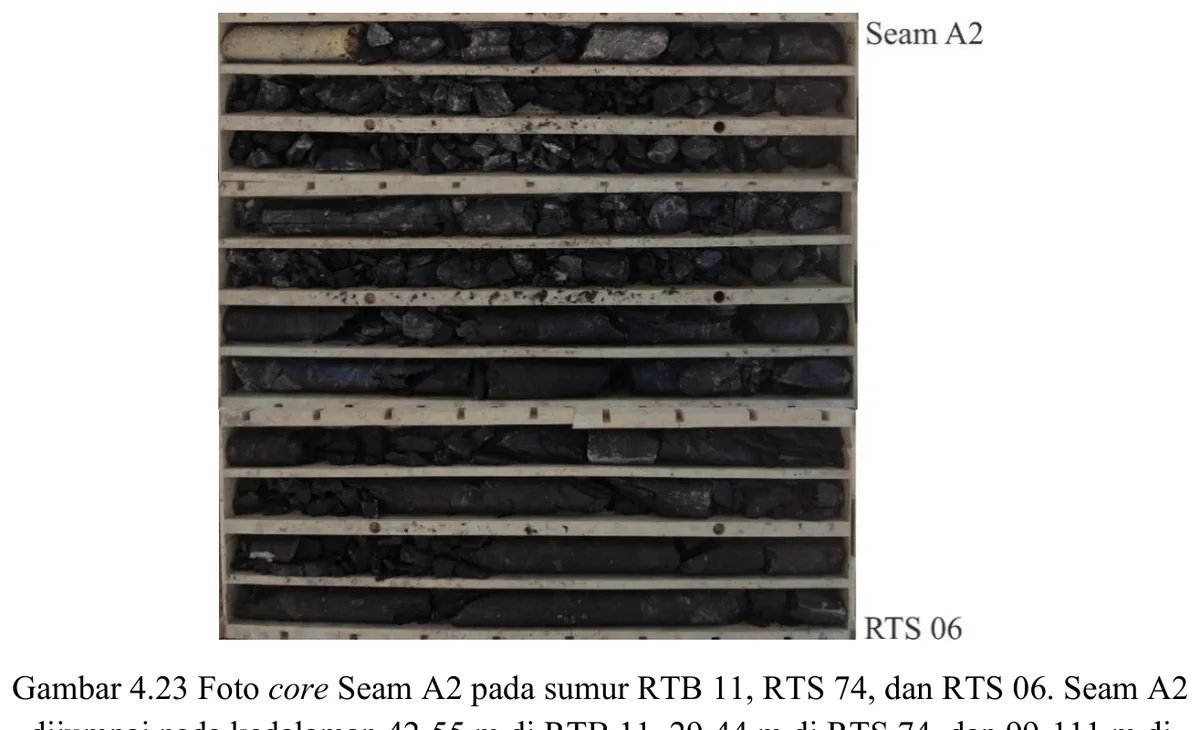
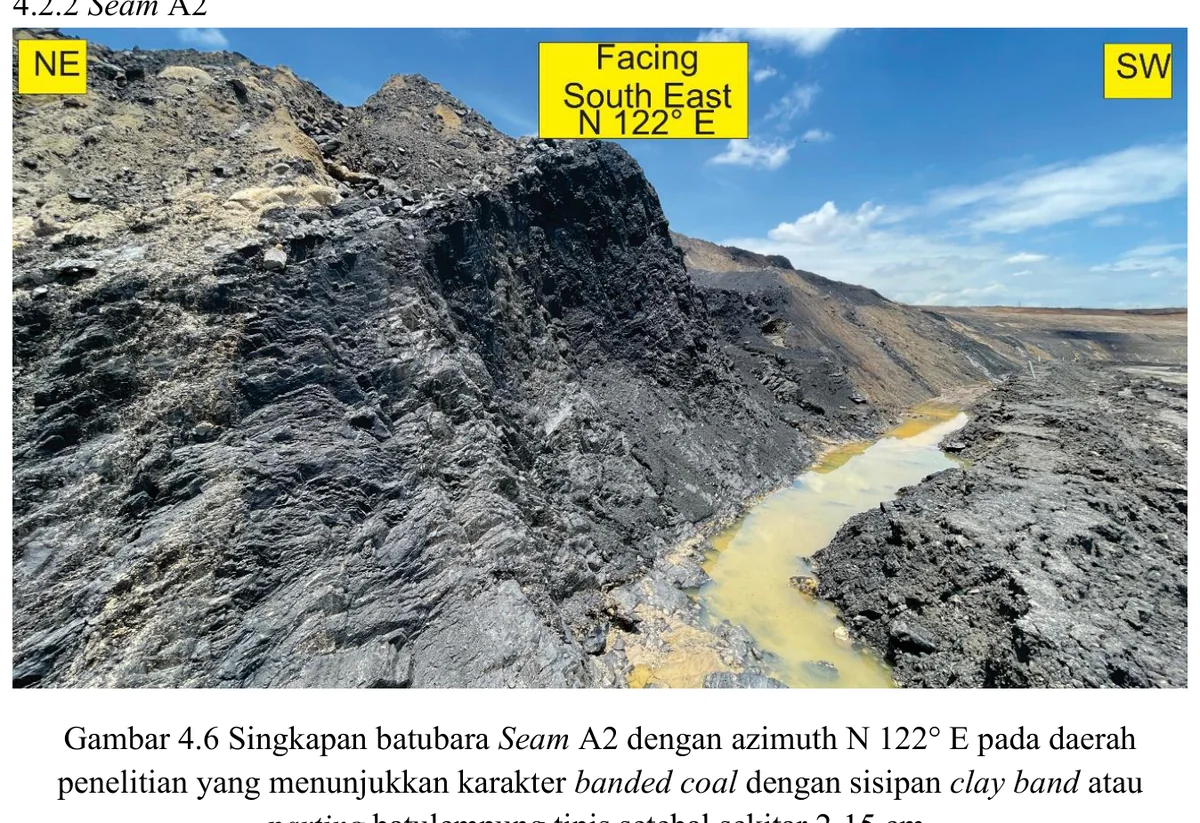
The core panel records the vertical lithologic succession through Seam A2.
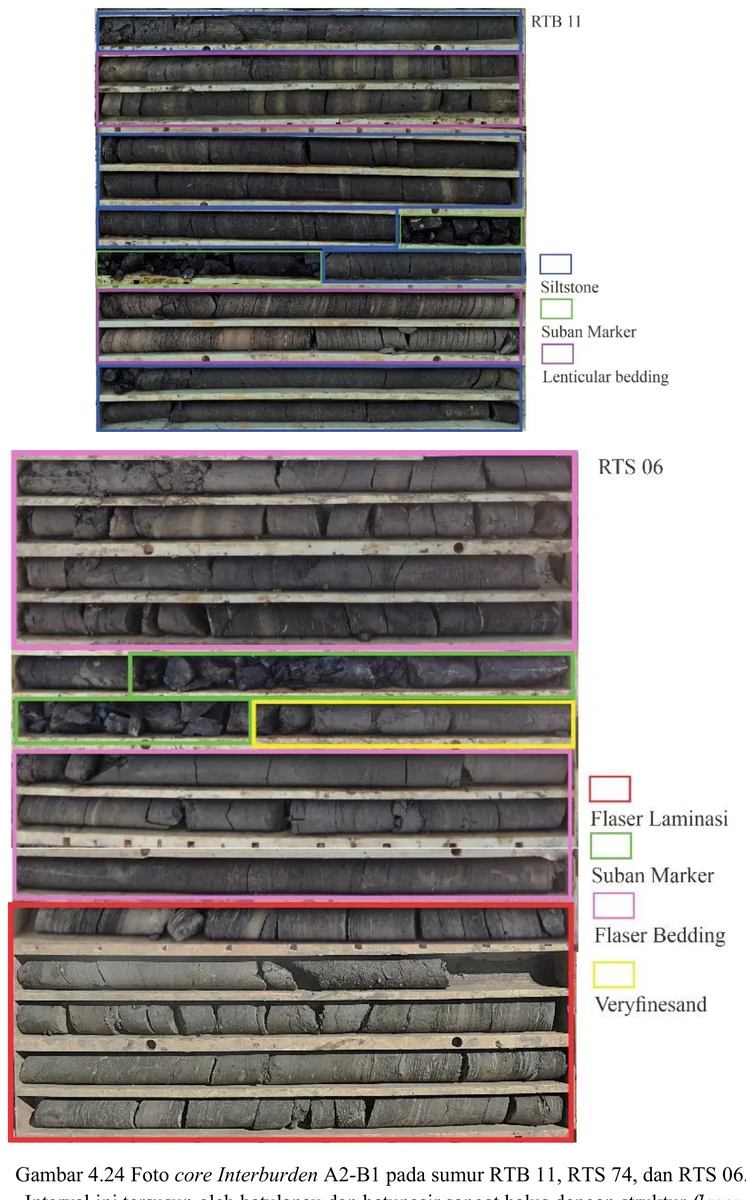
The core panel records the vertical lithologic succession through A2–B1 interburden.
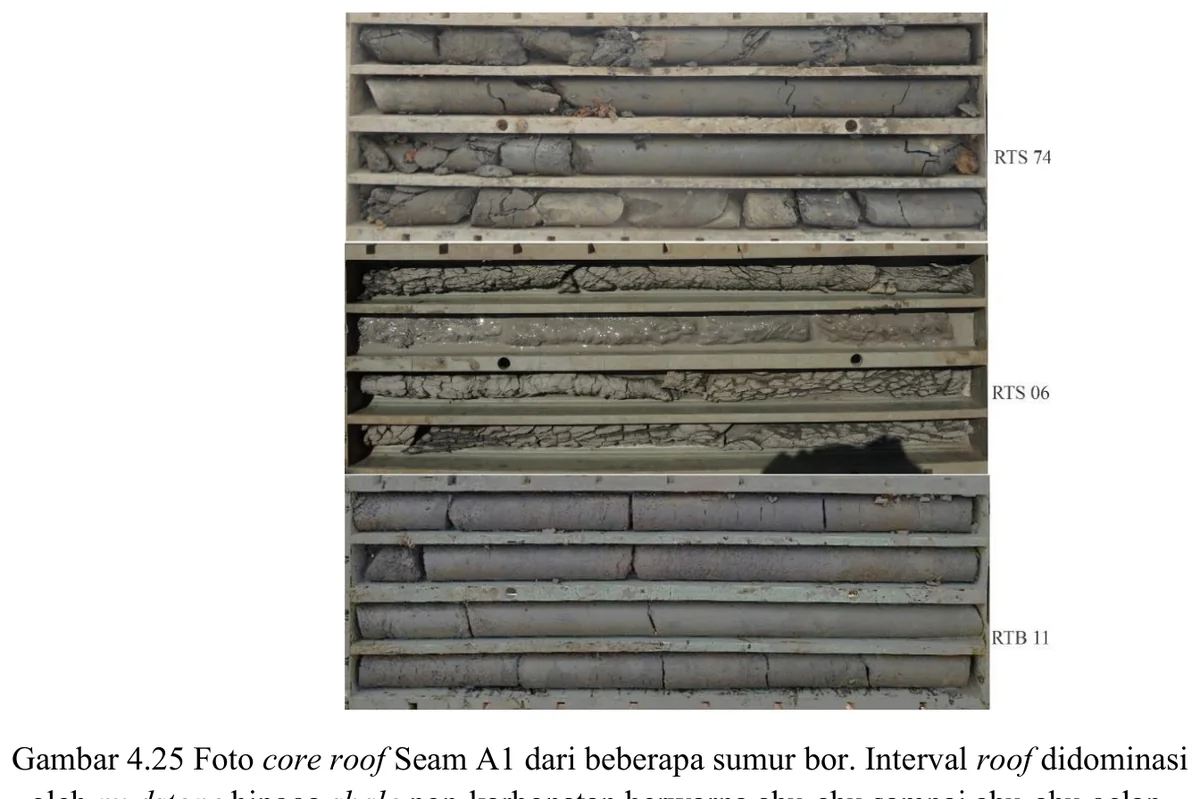
The core panel records the vertical lithologic succession through roof of Seam A1.
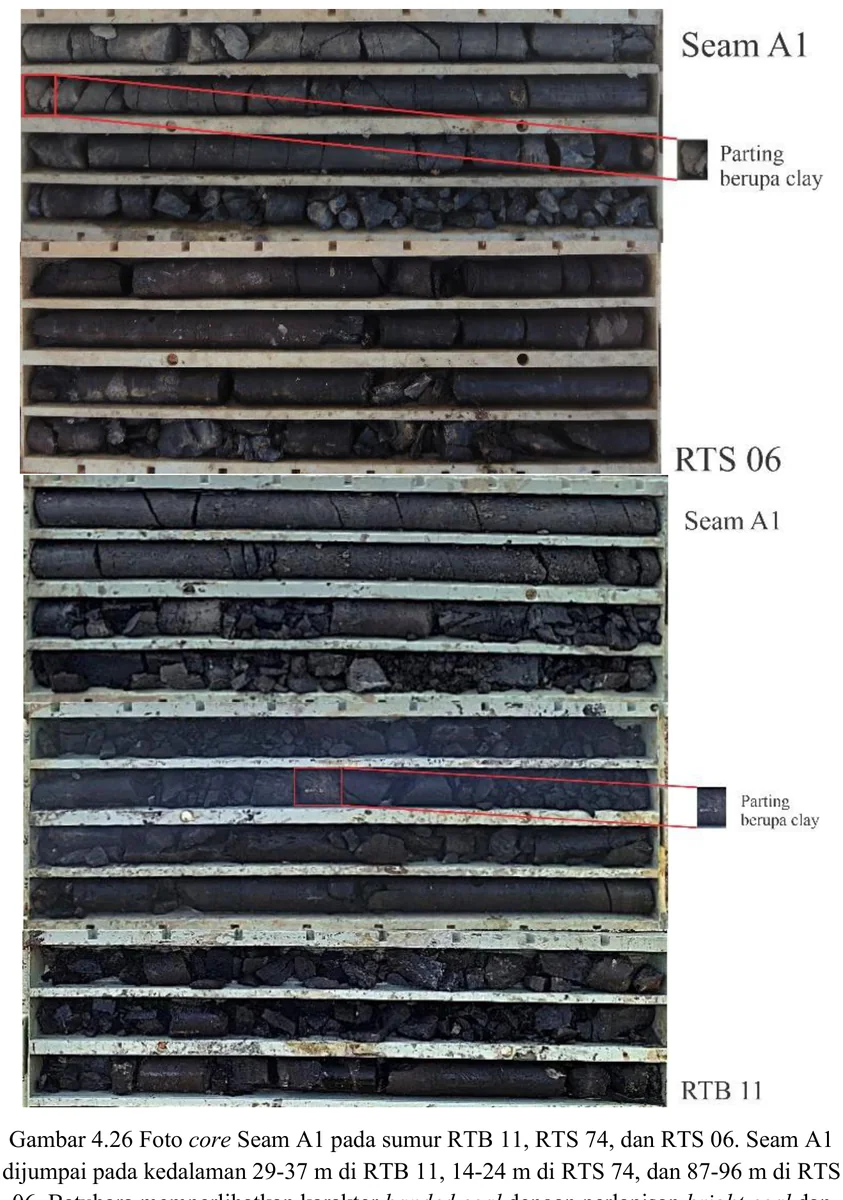
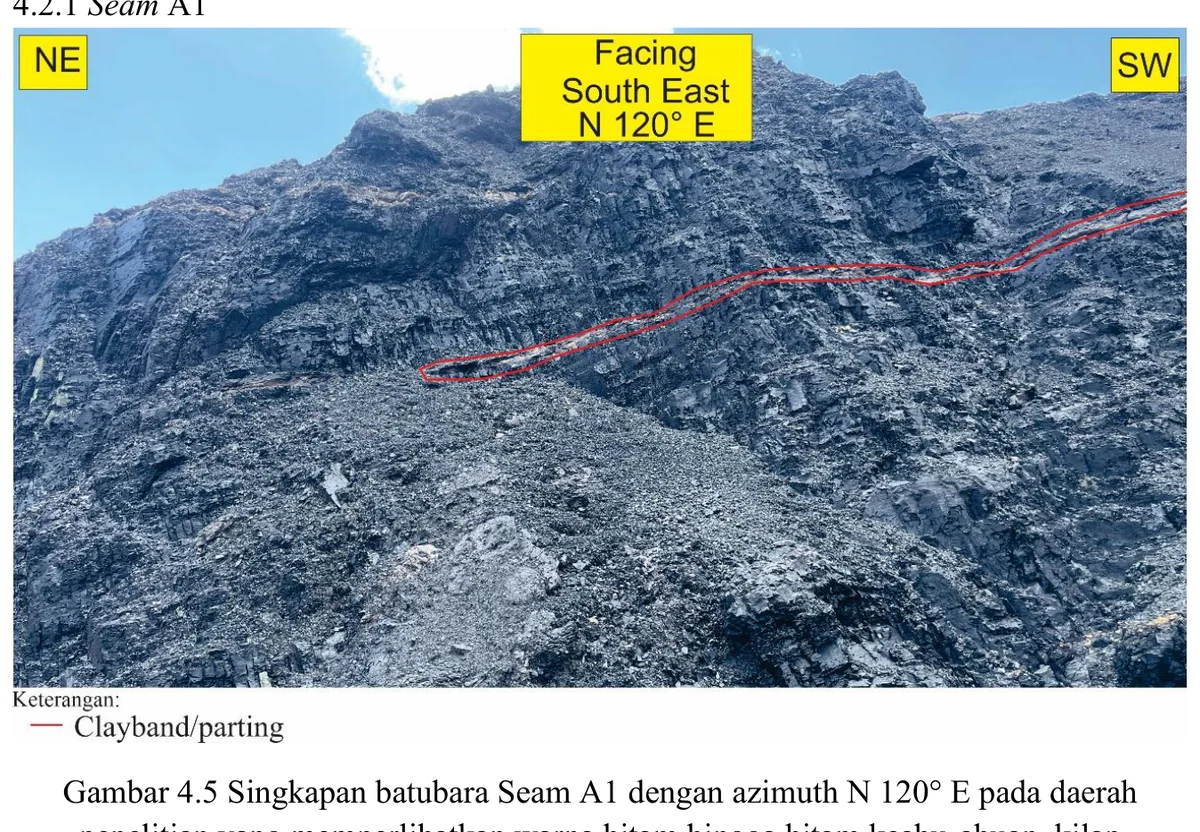
The core panel records the vertical lithologic succession through Seam A1.

The core panel records the vertical lithologic succession through A1–A2 interburden.
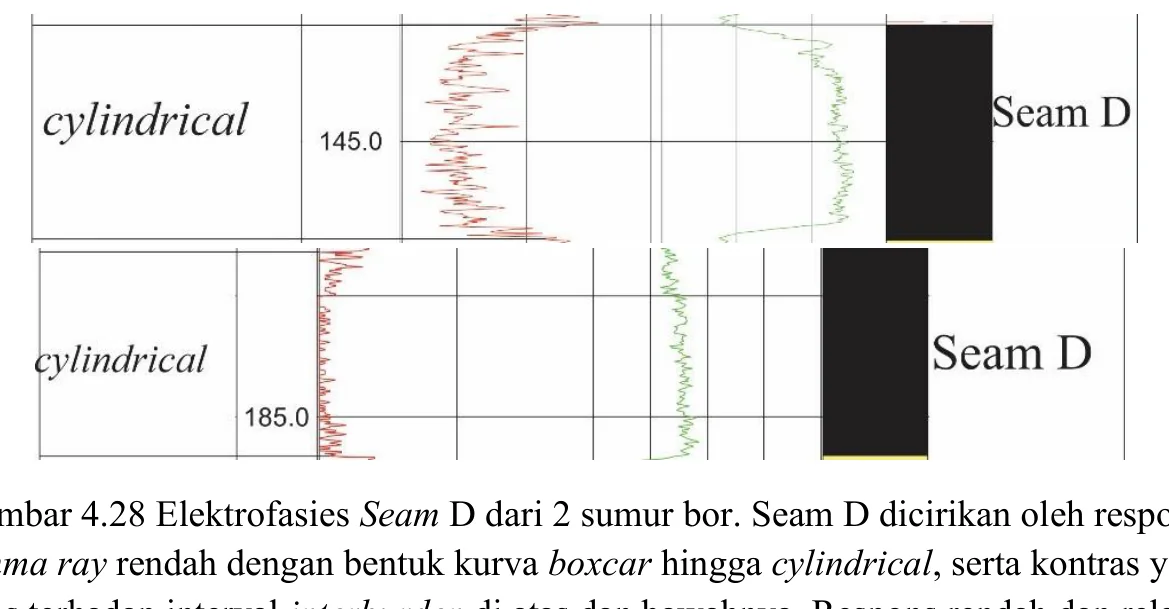
Gamma-ray, lithology and correlated markers are displayed for Seam D.
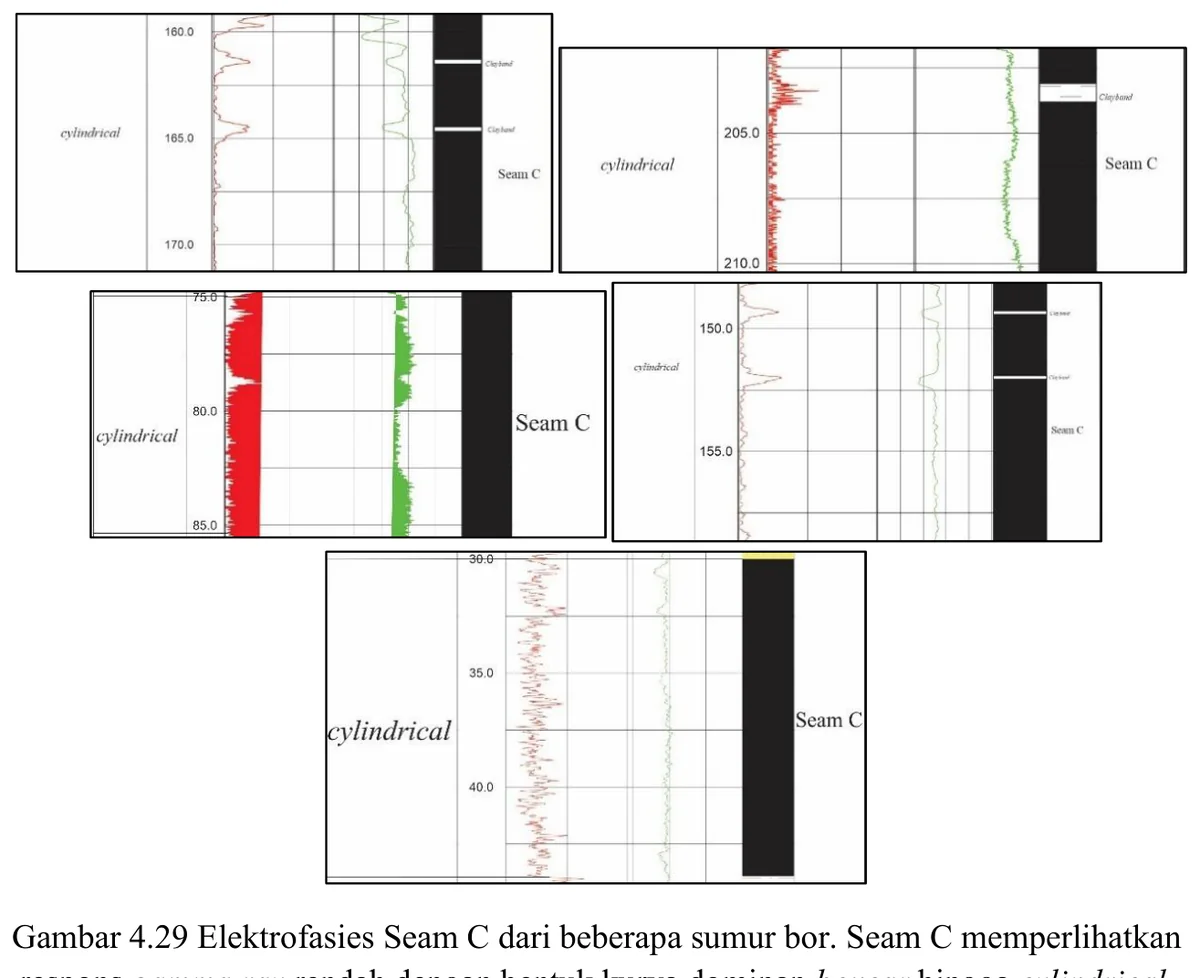
Gamma-ray, lithology and correlated markers are displayed for Seam C.
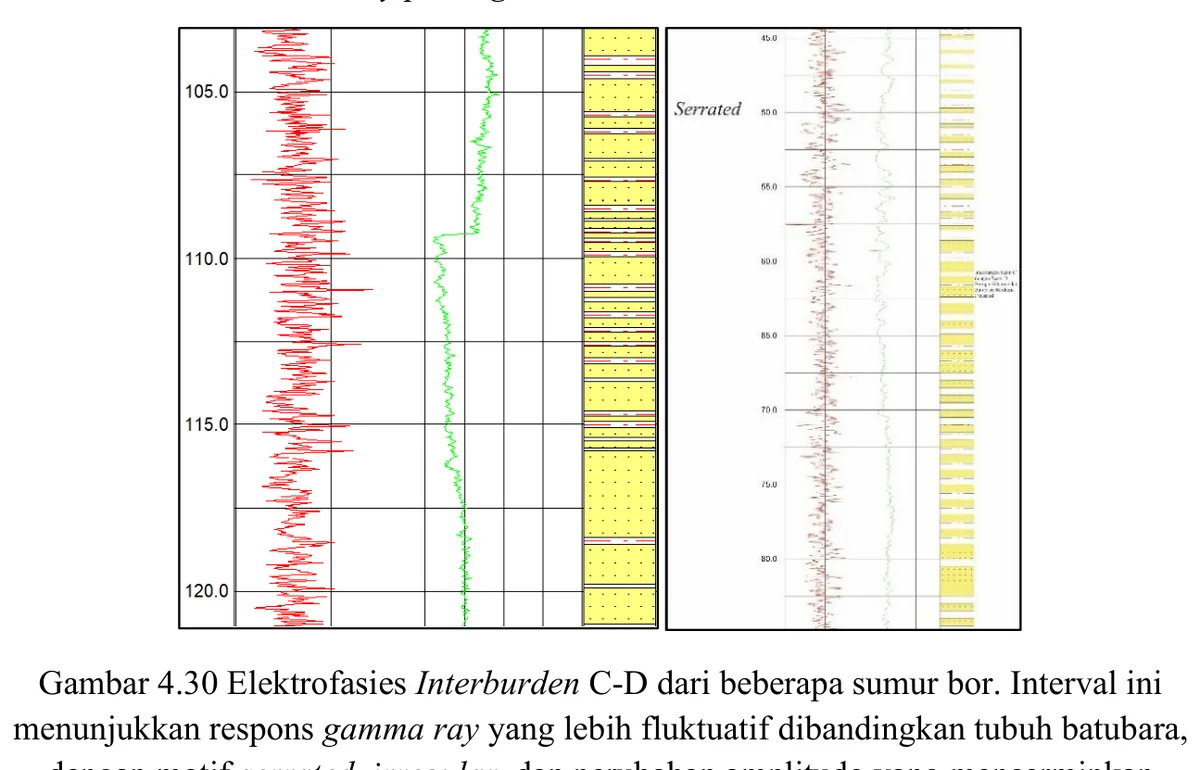
Gamma-ray, lithology and correlated markers are displayed for C–D interburden.
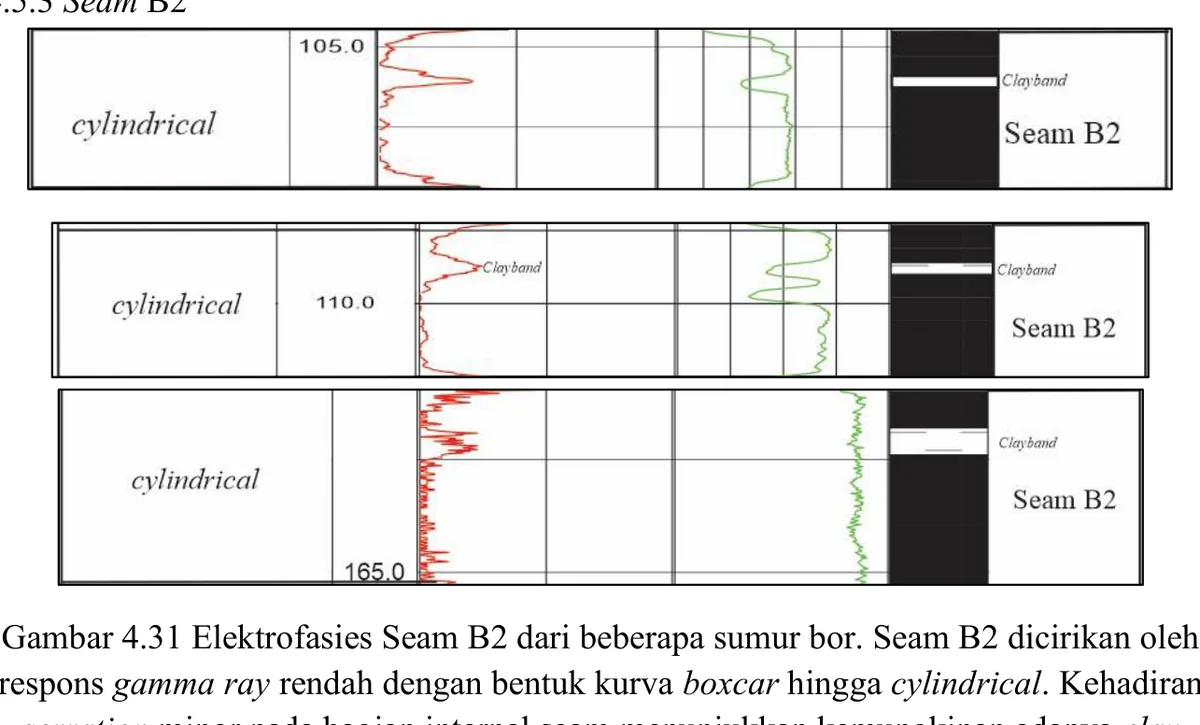
Gamma-ray, lithology and correlated markers are displayed for Seam B2.
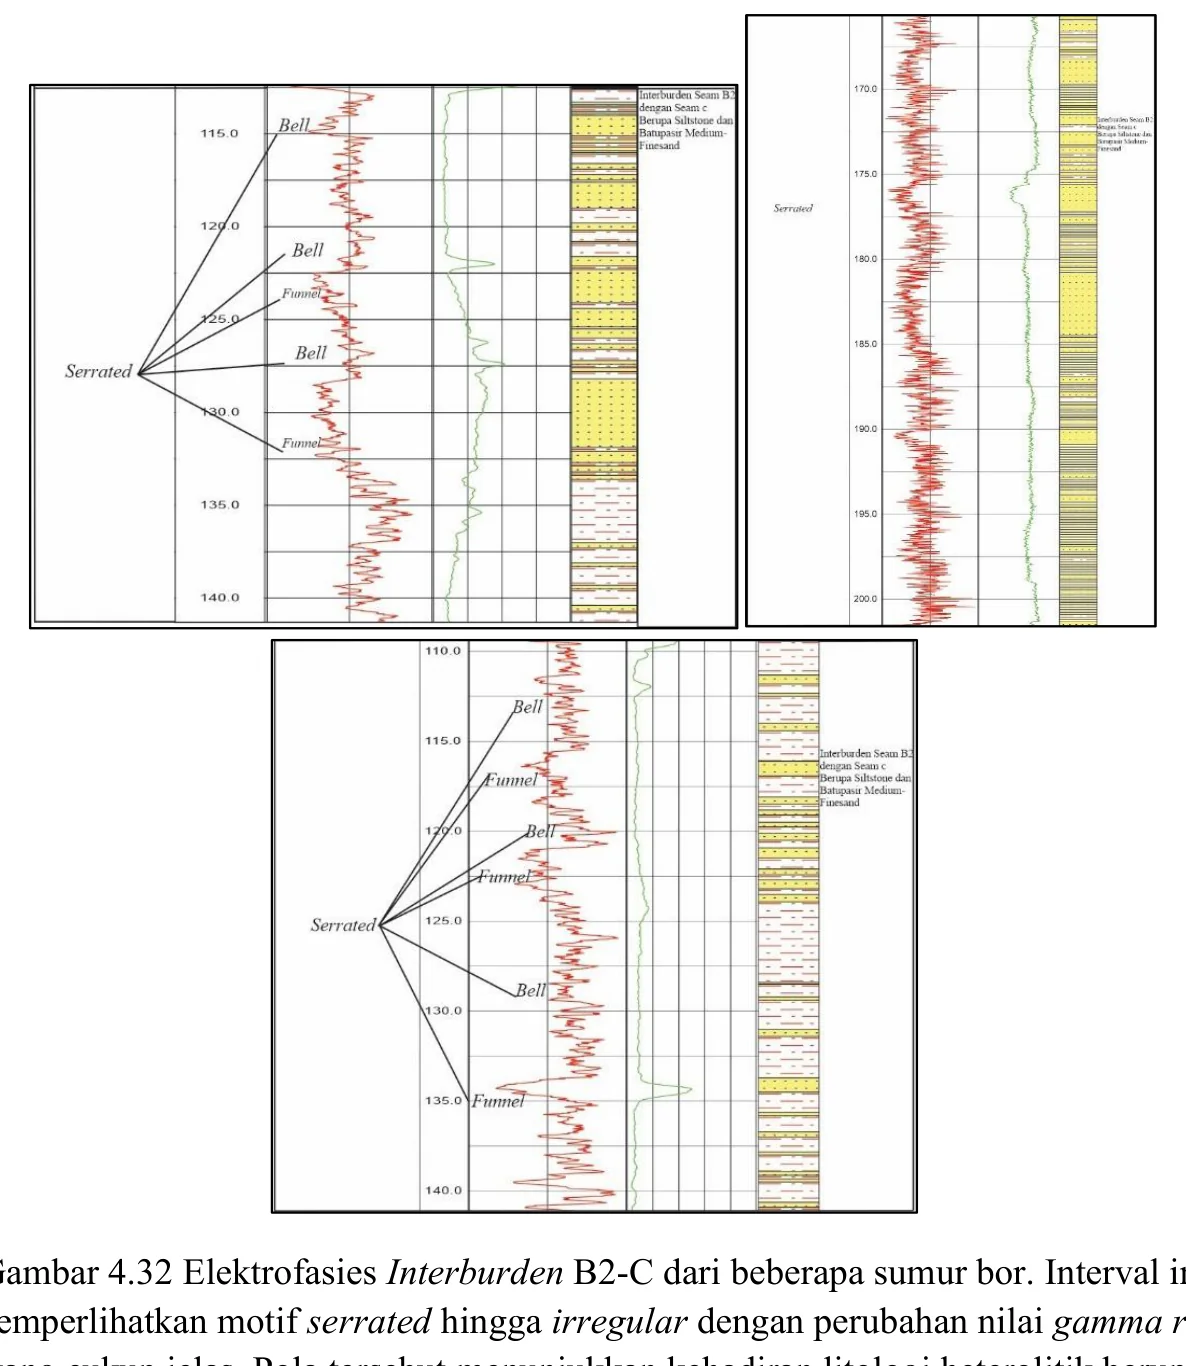
Gamma-ray, lithology and correlated markers are displayed for B2–C interburden.
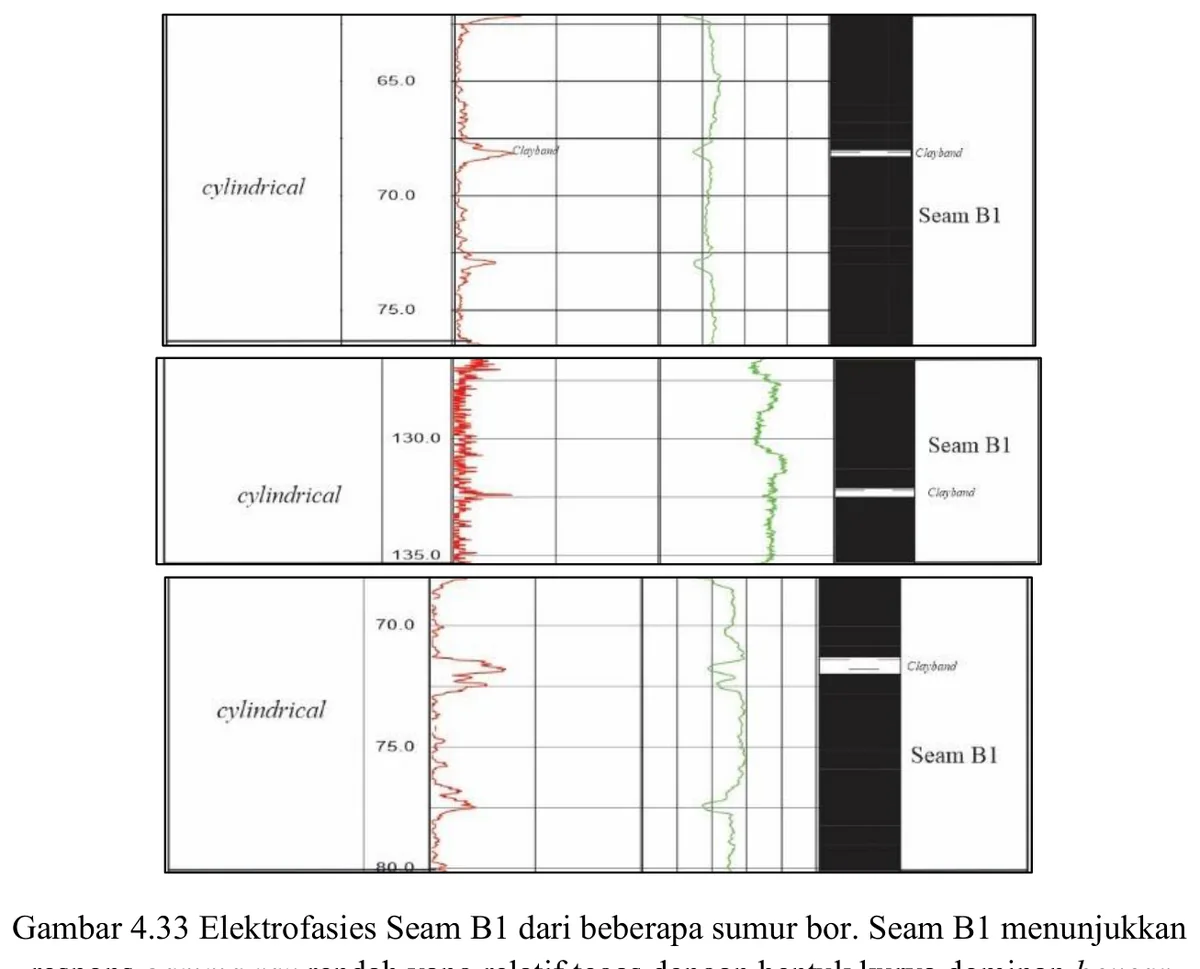
Gamma-ray, lithology and correlated markers are displayed for Seam B1.
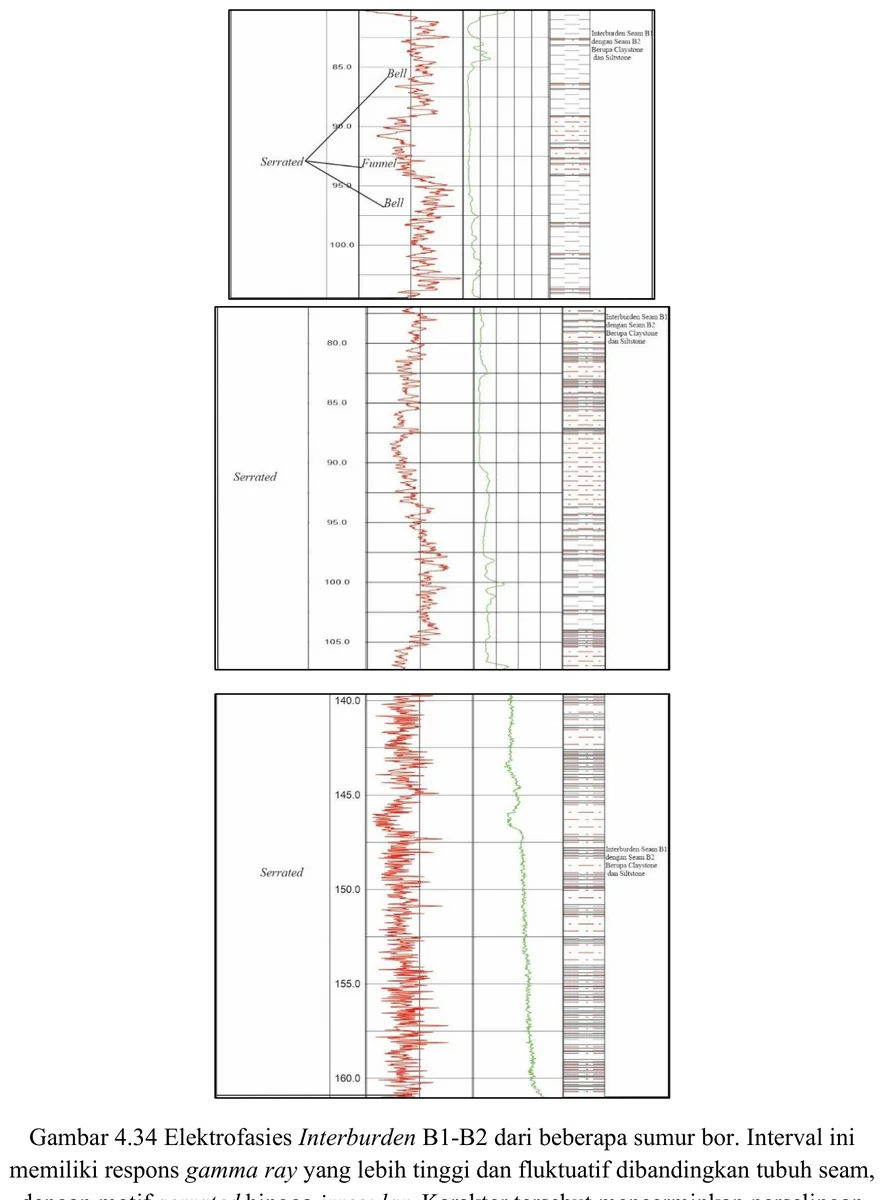
Gamma-ray, lithology and correlated markers are displayed for B1–B2 interburden.
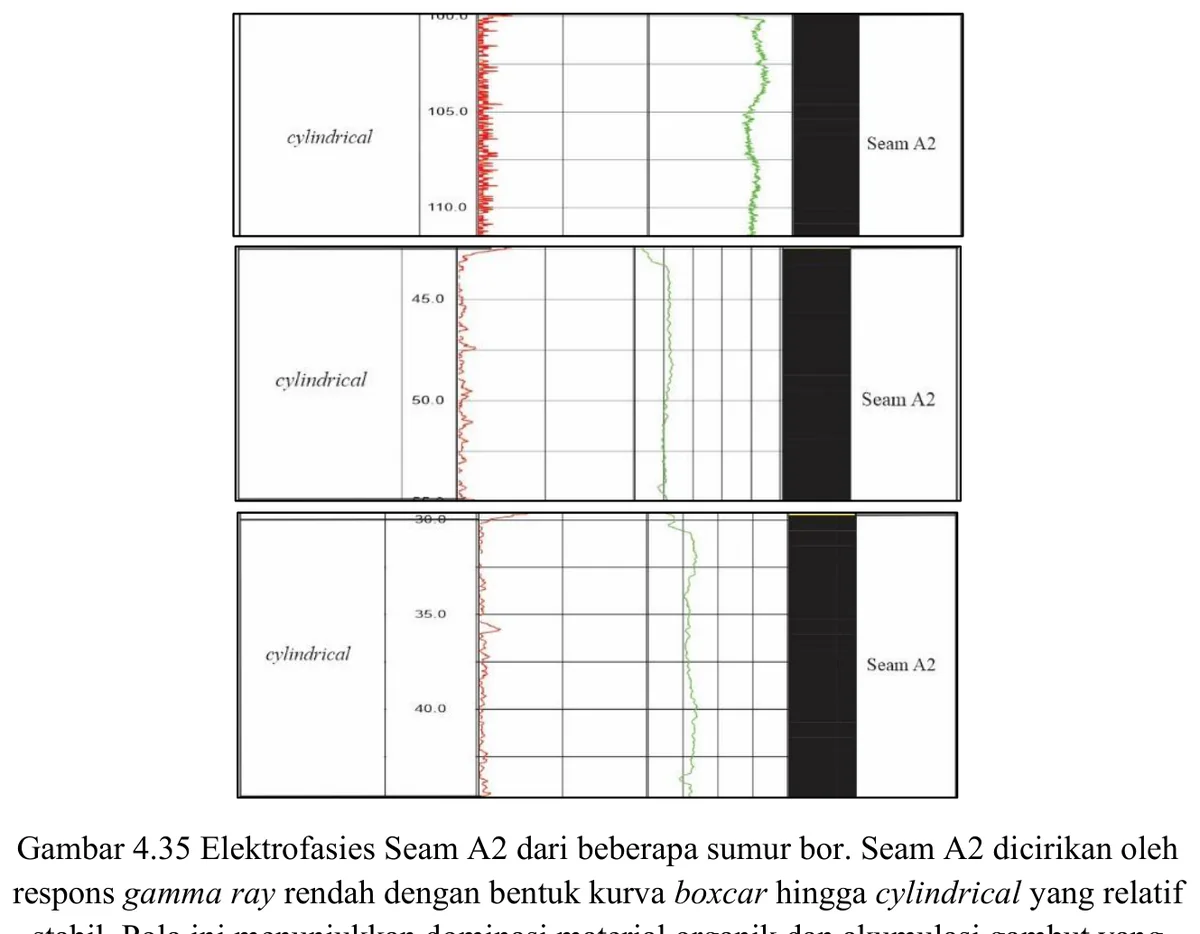
Gamma-ray, lithology and correlated markers are displayed for Seam A2.
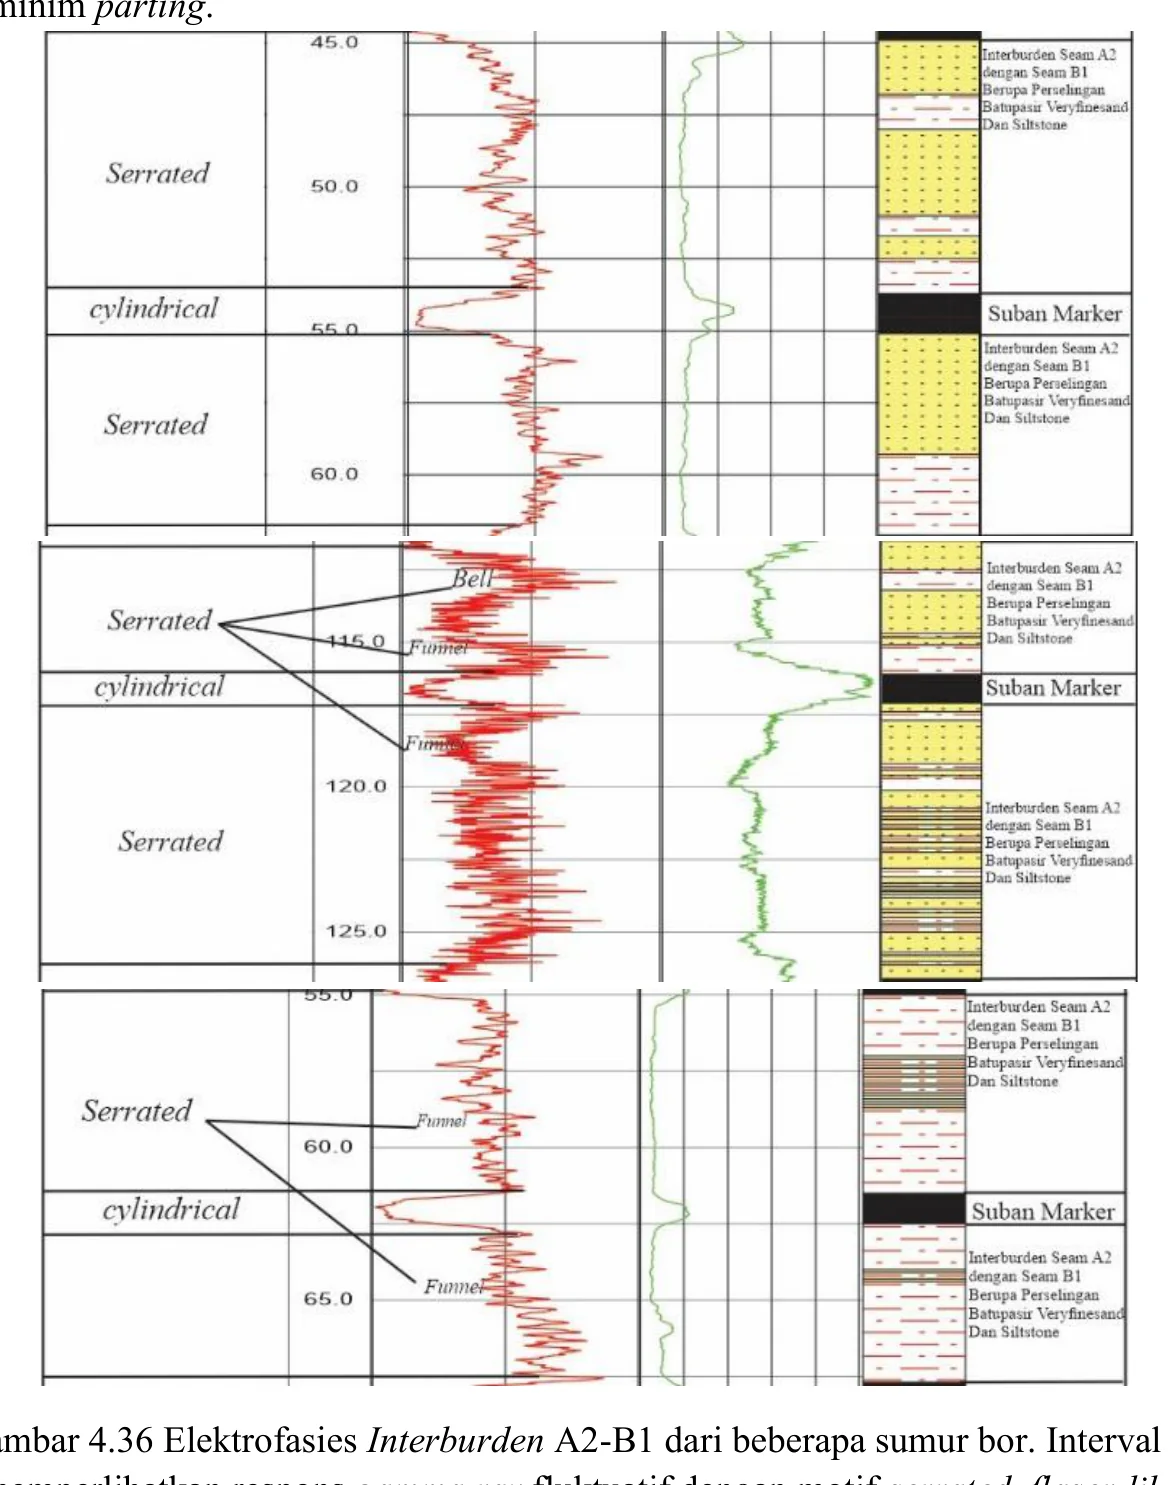
Gamma-ray, lithology and correlated markers are displayed for A2–B1 interburden.
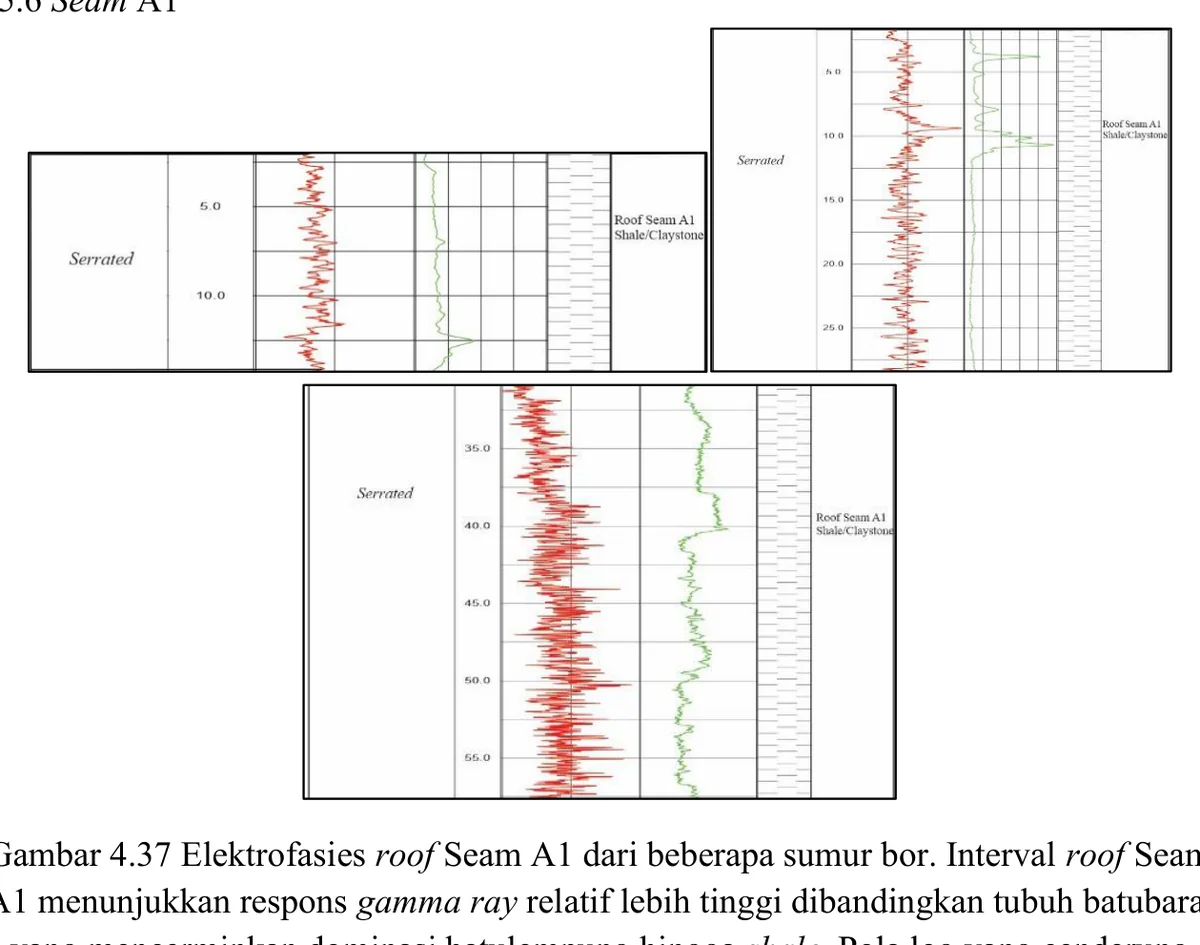
Gamma-ray, lithology and correlated markers are displayed for roof of Seam A1.
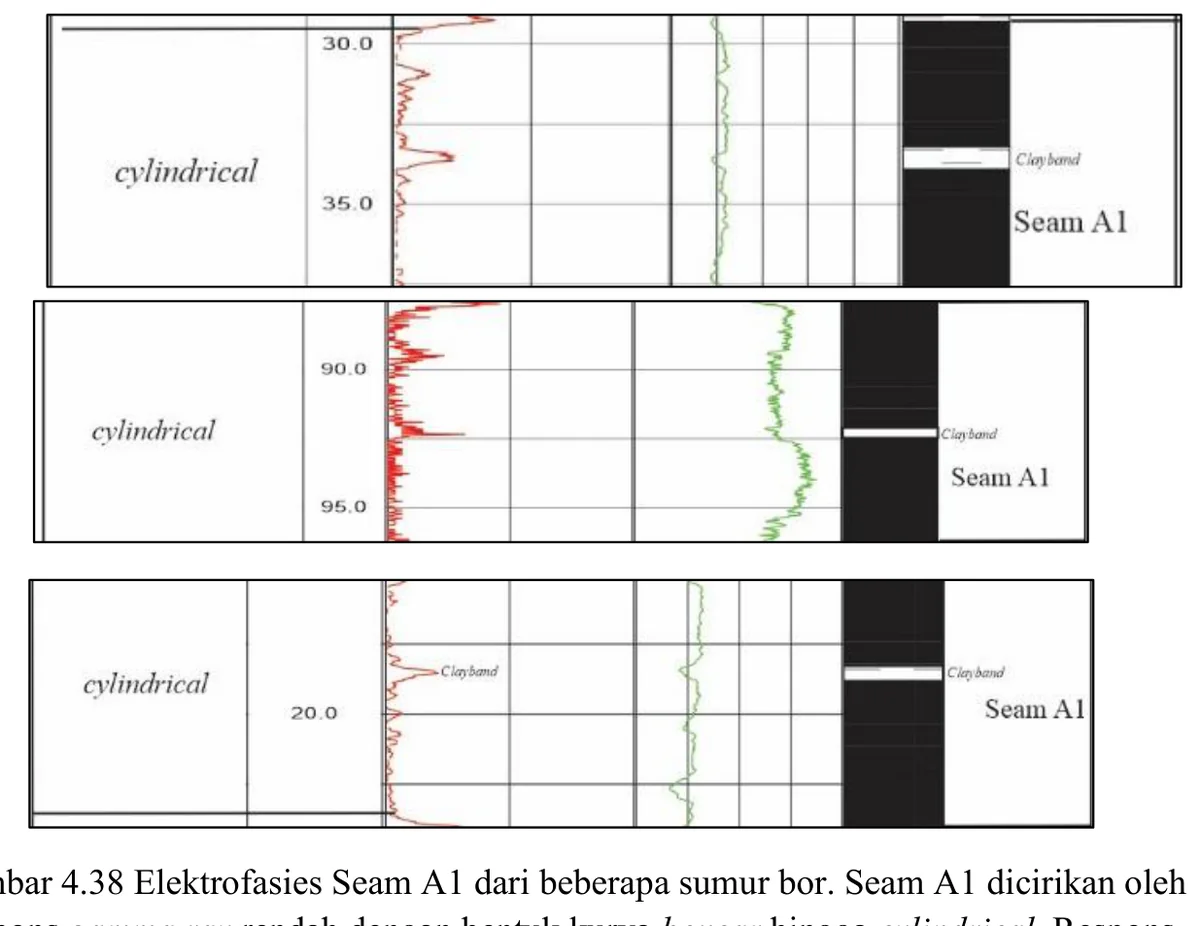
Gamma-ray, lithology and correlated markers are displayed for Seam A1.
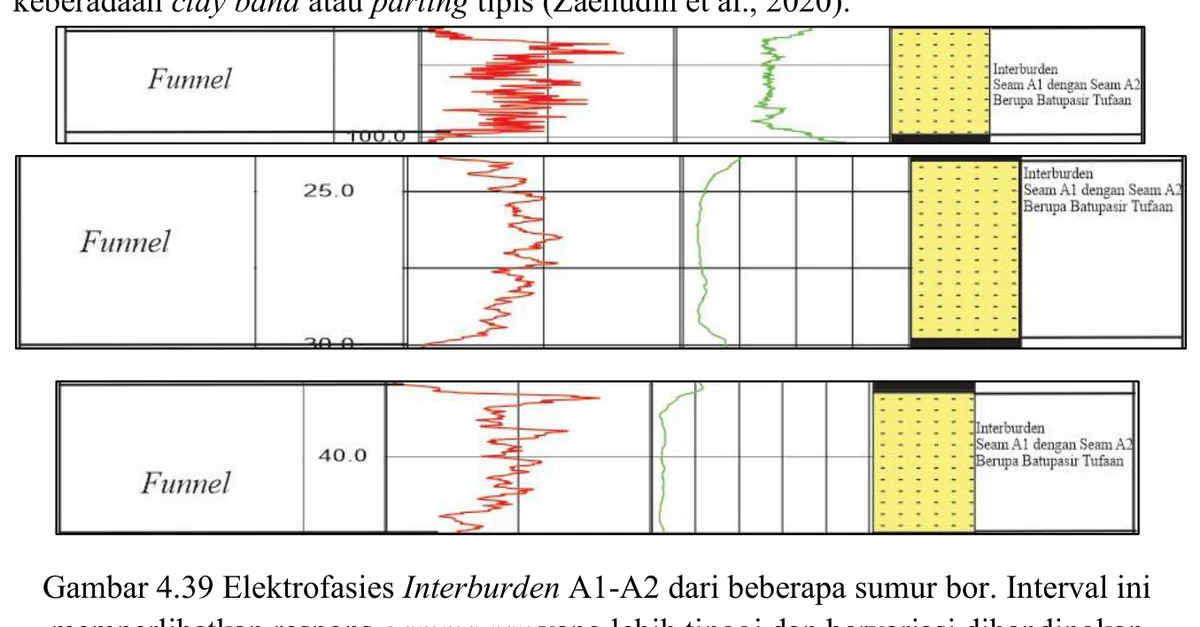
Gamma-ray, lithology and correlated markers are displayed for A1–A2 interburden.
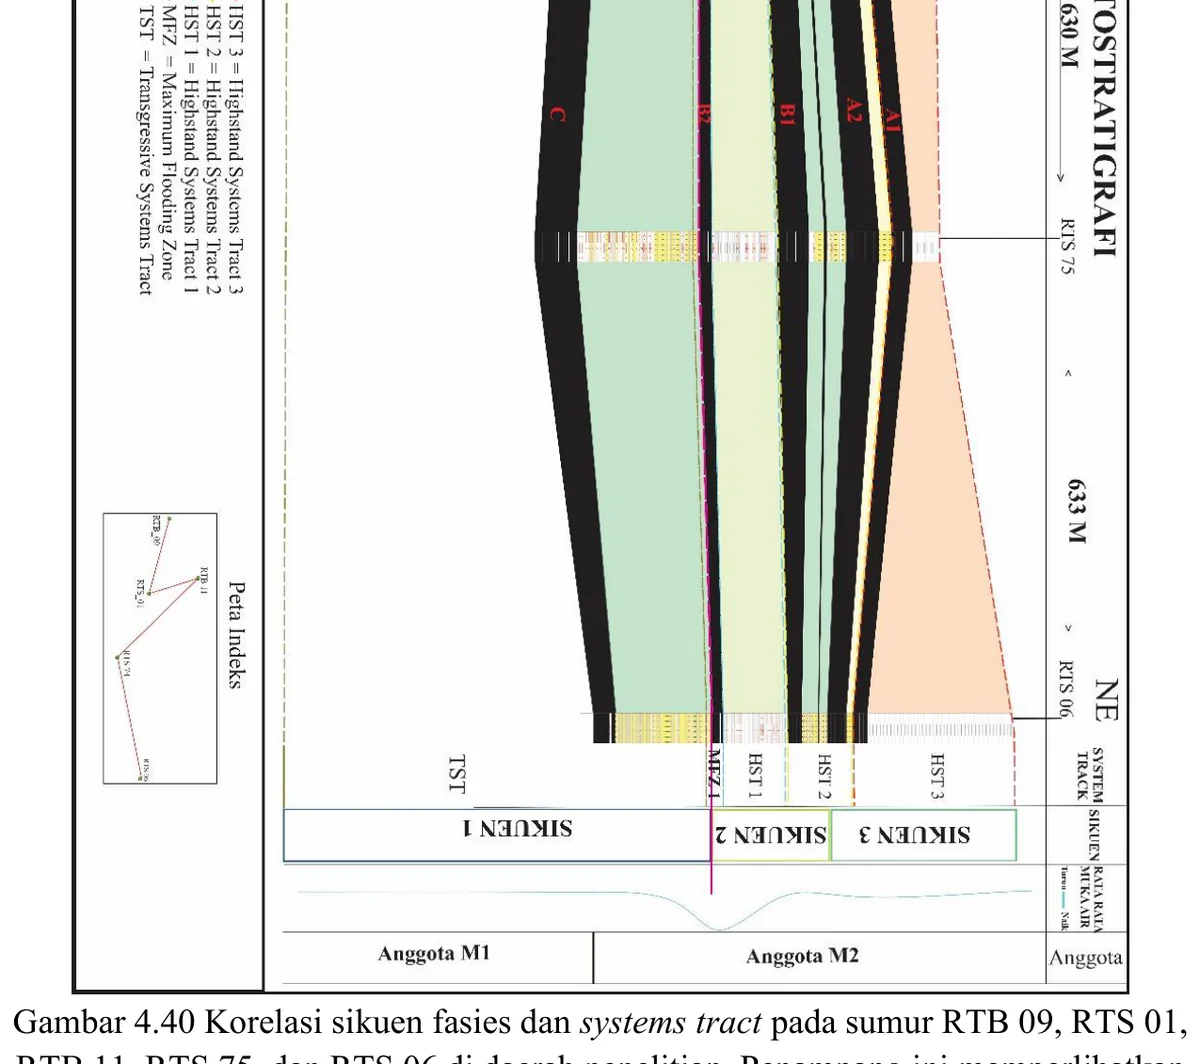
The multiwell panel integrates facies, markers and interpreted stratigraphic packages across five wells.
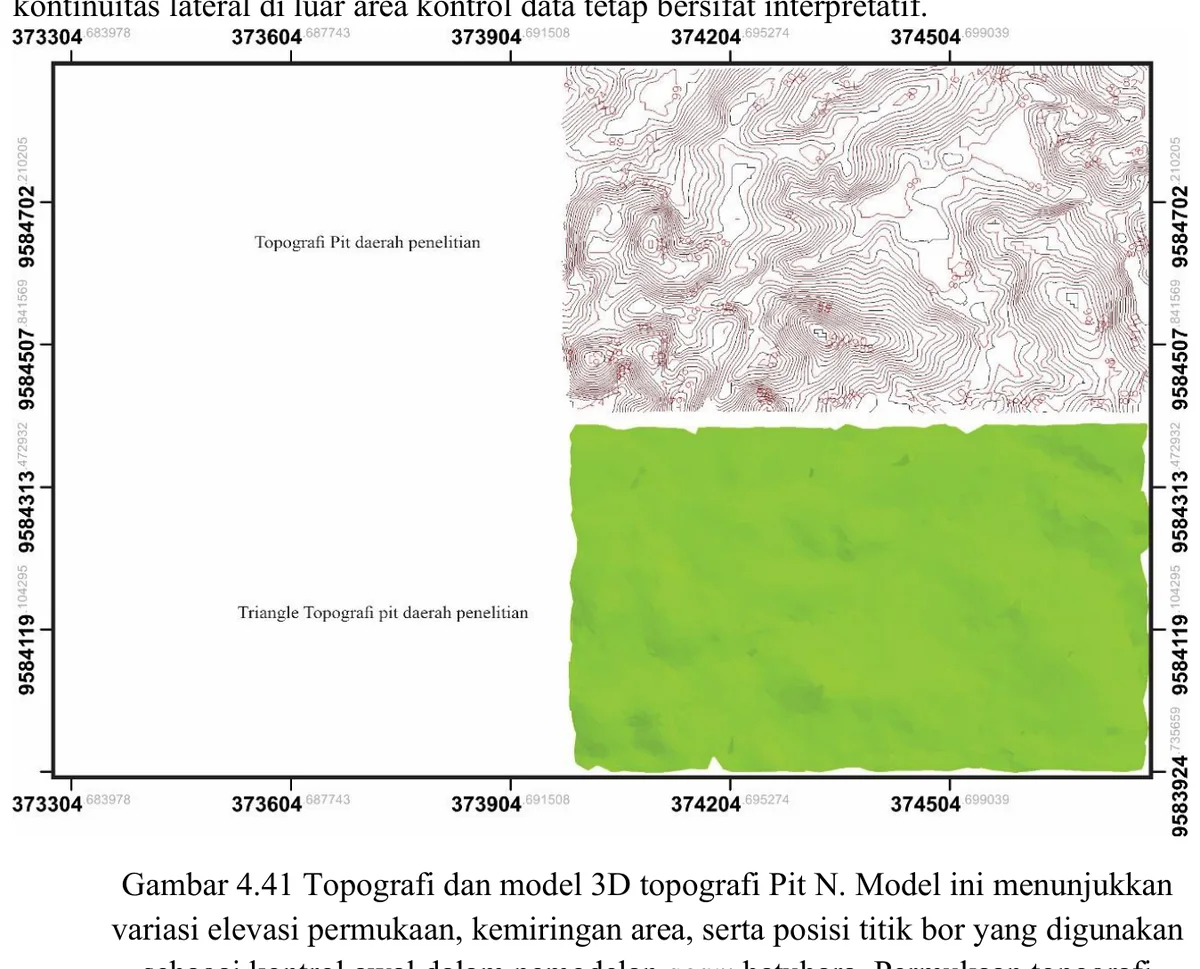
Topographic data are displayed as the surface control for the three-dimensional model.
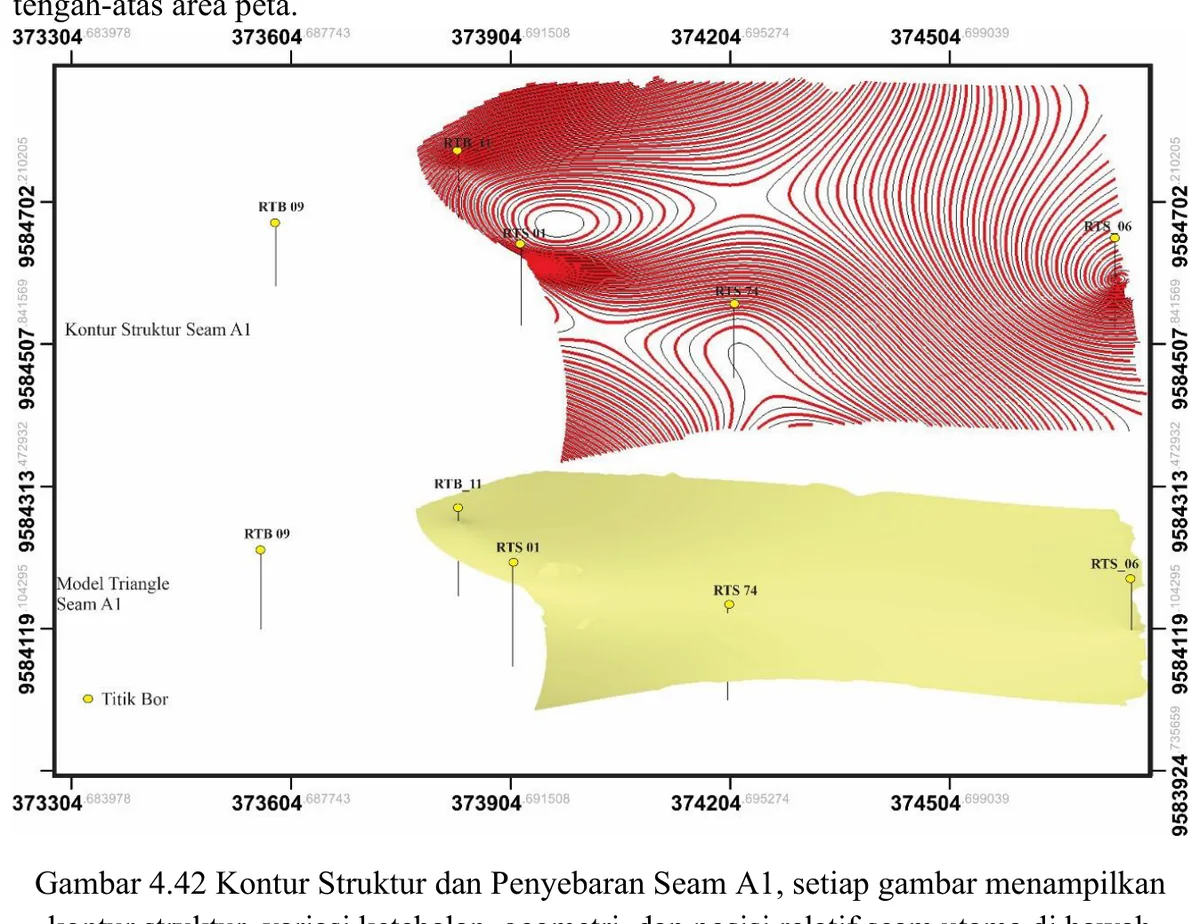
The structure-contour map and surface represent the interpreted elevation of Seam A1.
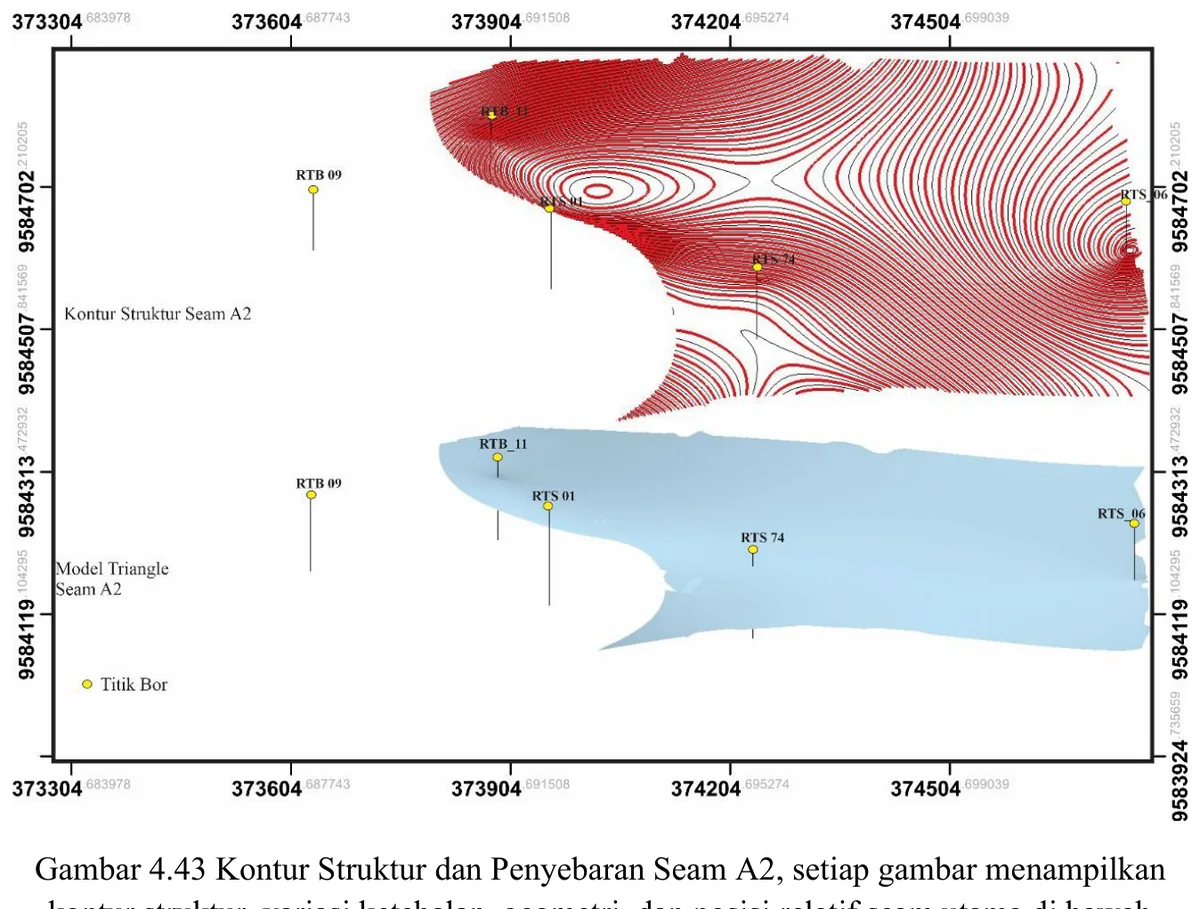
The structure-contour map and surface represent the interpreted elevation of Seam A2.
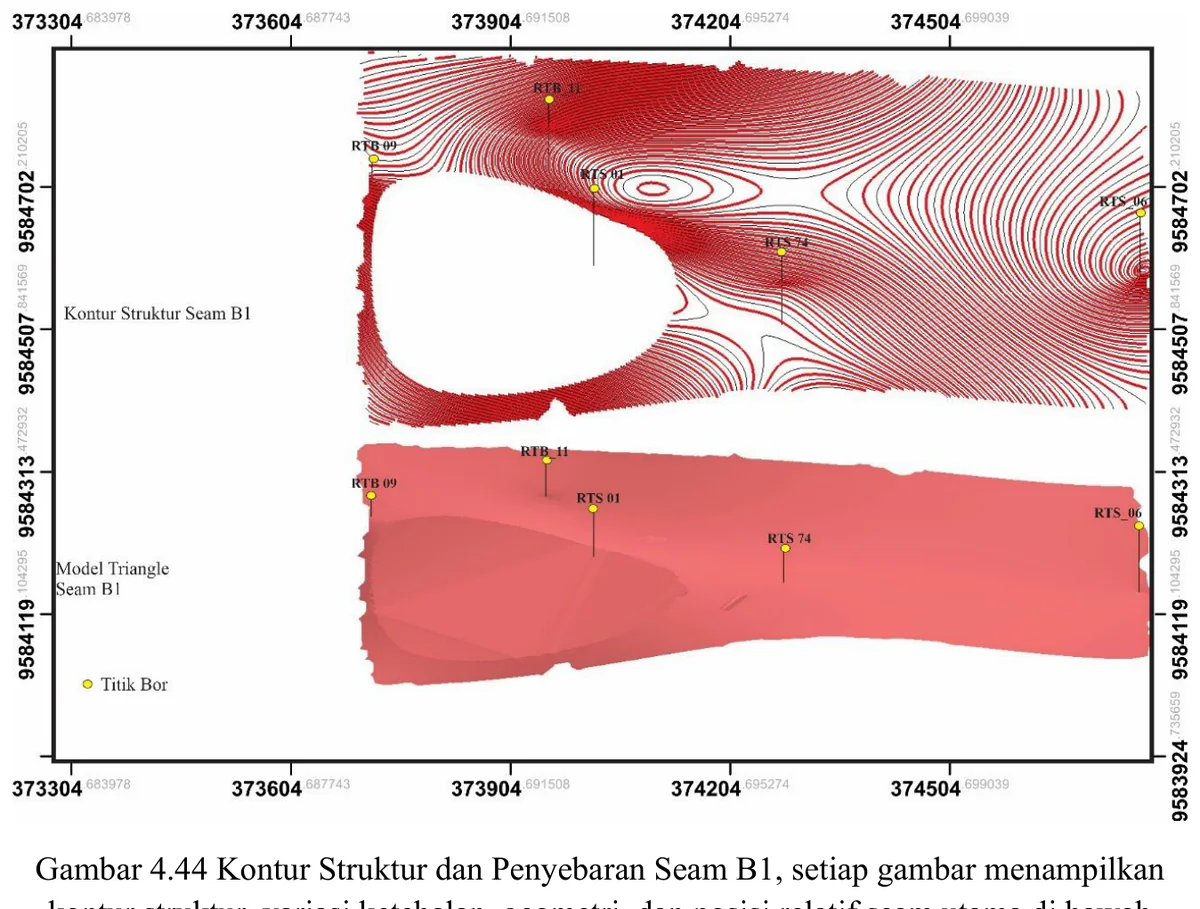
The structure-contour map and surface represent the interpreted elevation of Seam B1.
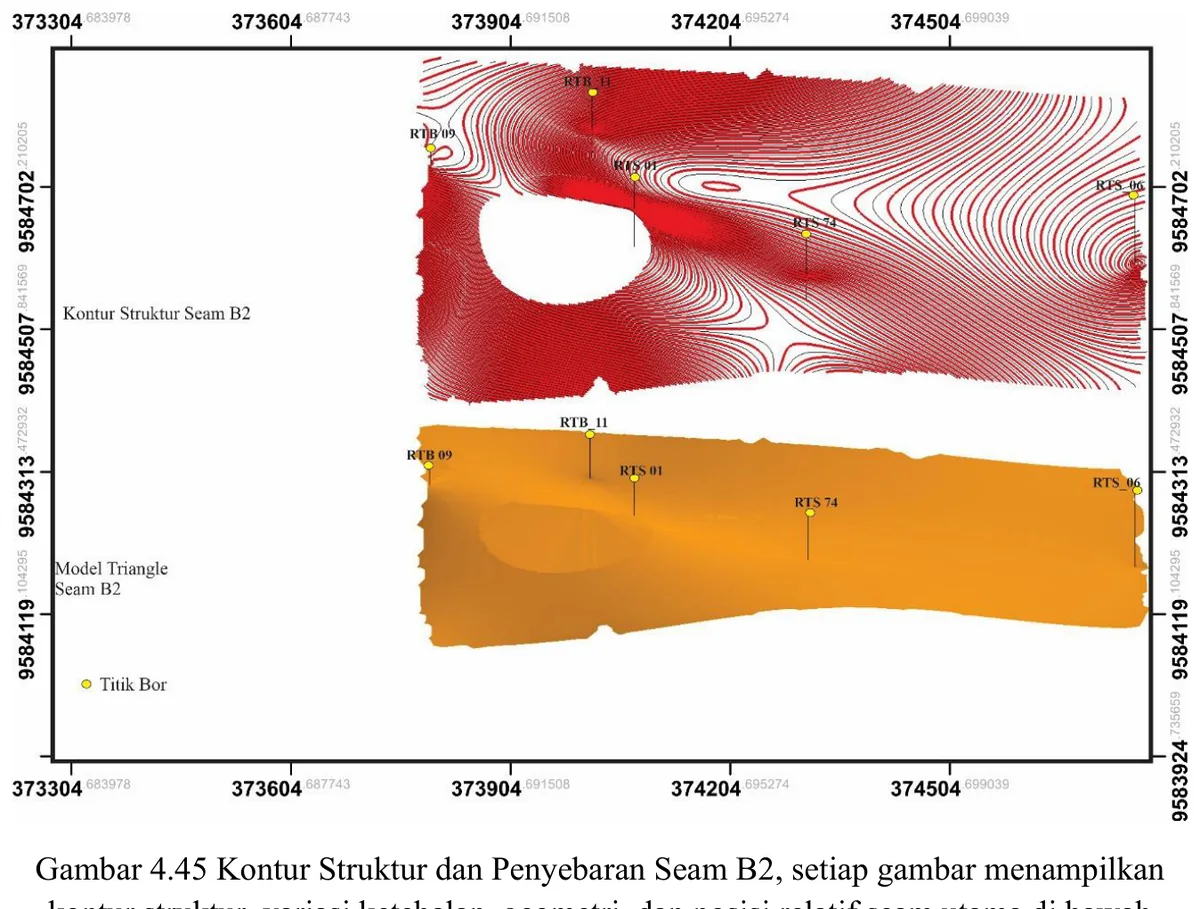
The structure-contour map and surface represent the interpreted elevation of Seam B2.
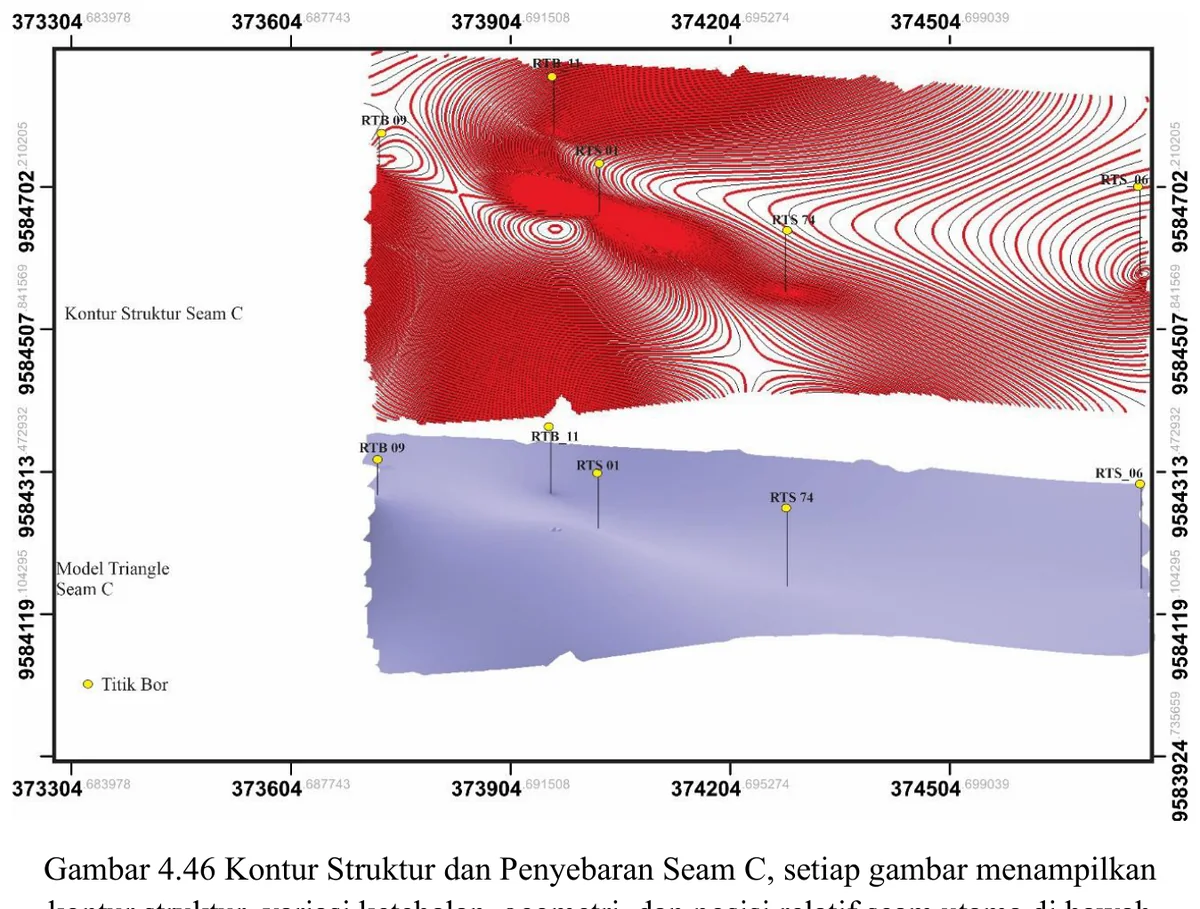
The structure-contour map and surface represent the interpreted elevation of Seam C.
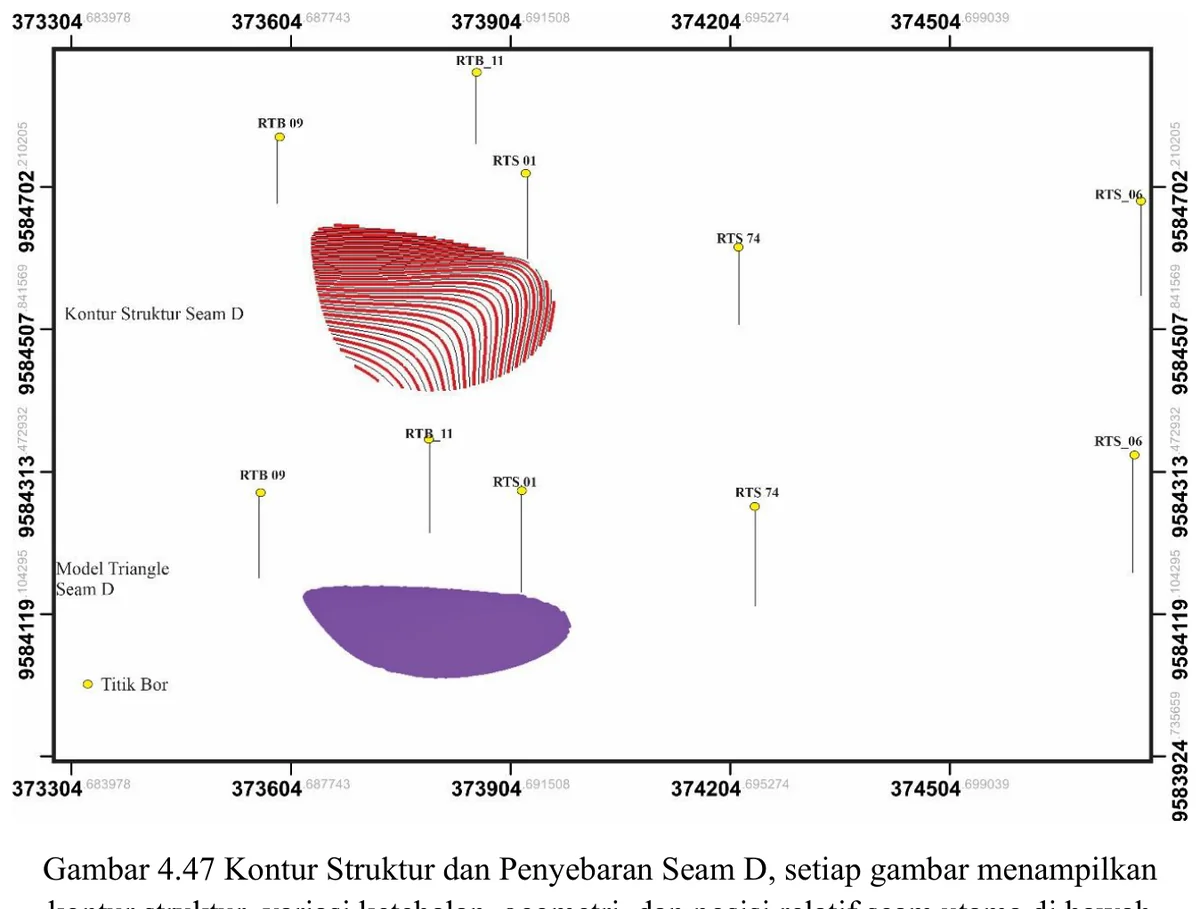
The structure-contour map and surface represent the interpreted elevation of Seam D.
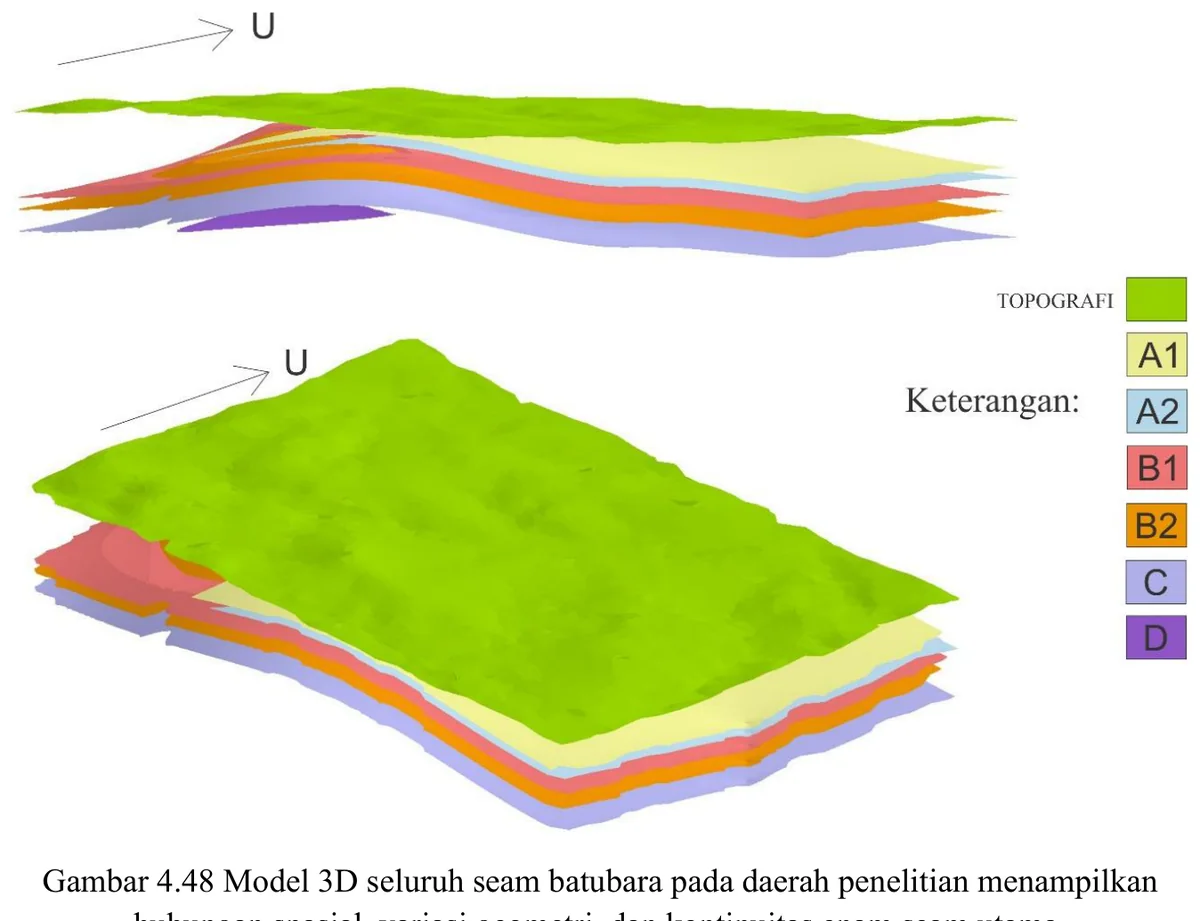
The model stacks the principal coal-seam surfaces within the topographic framework.
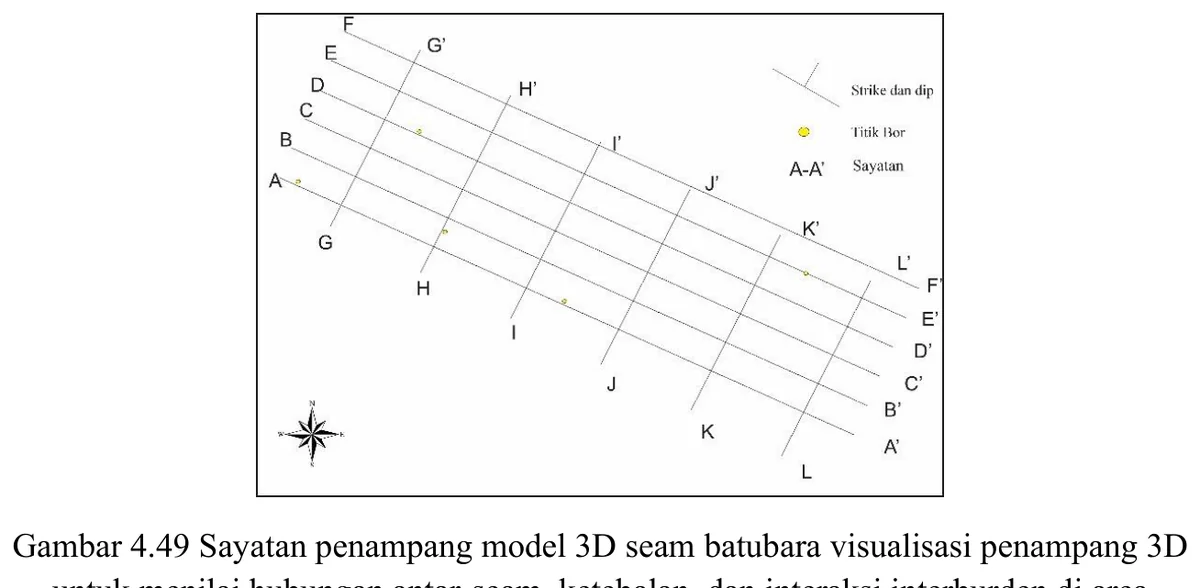
The section cuts through the three-dimensional seam surfaces to show their vertical and lateral relationships.
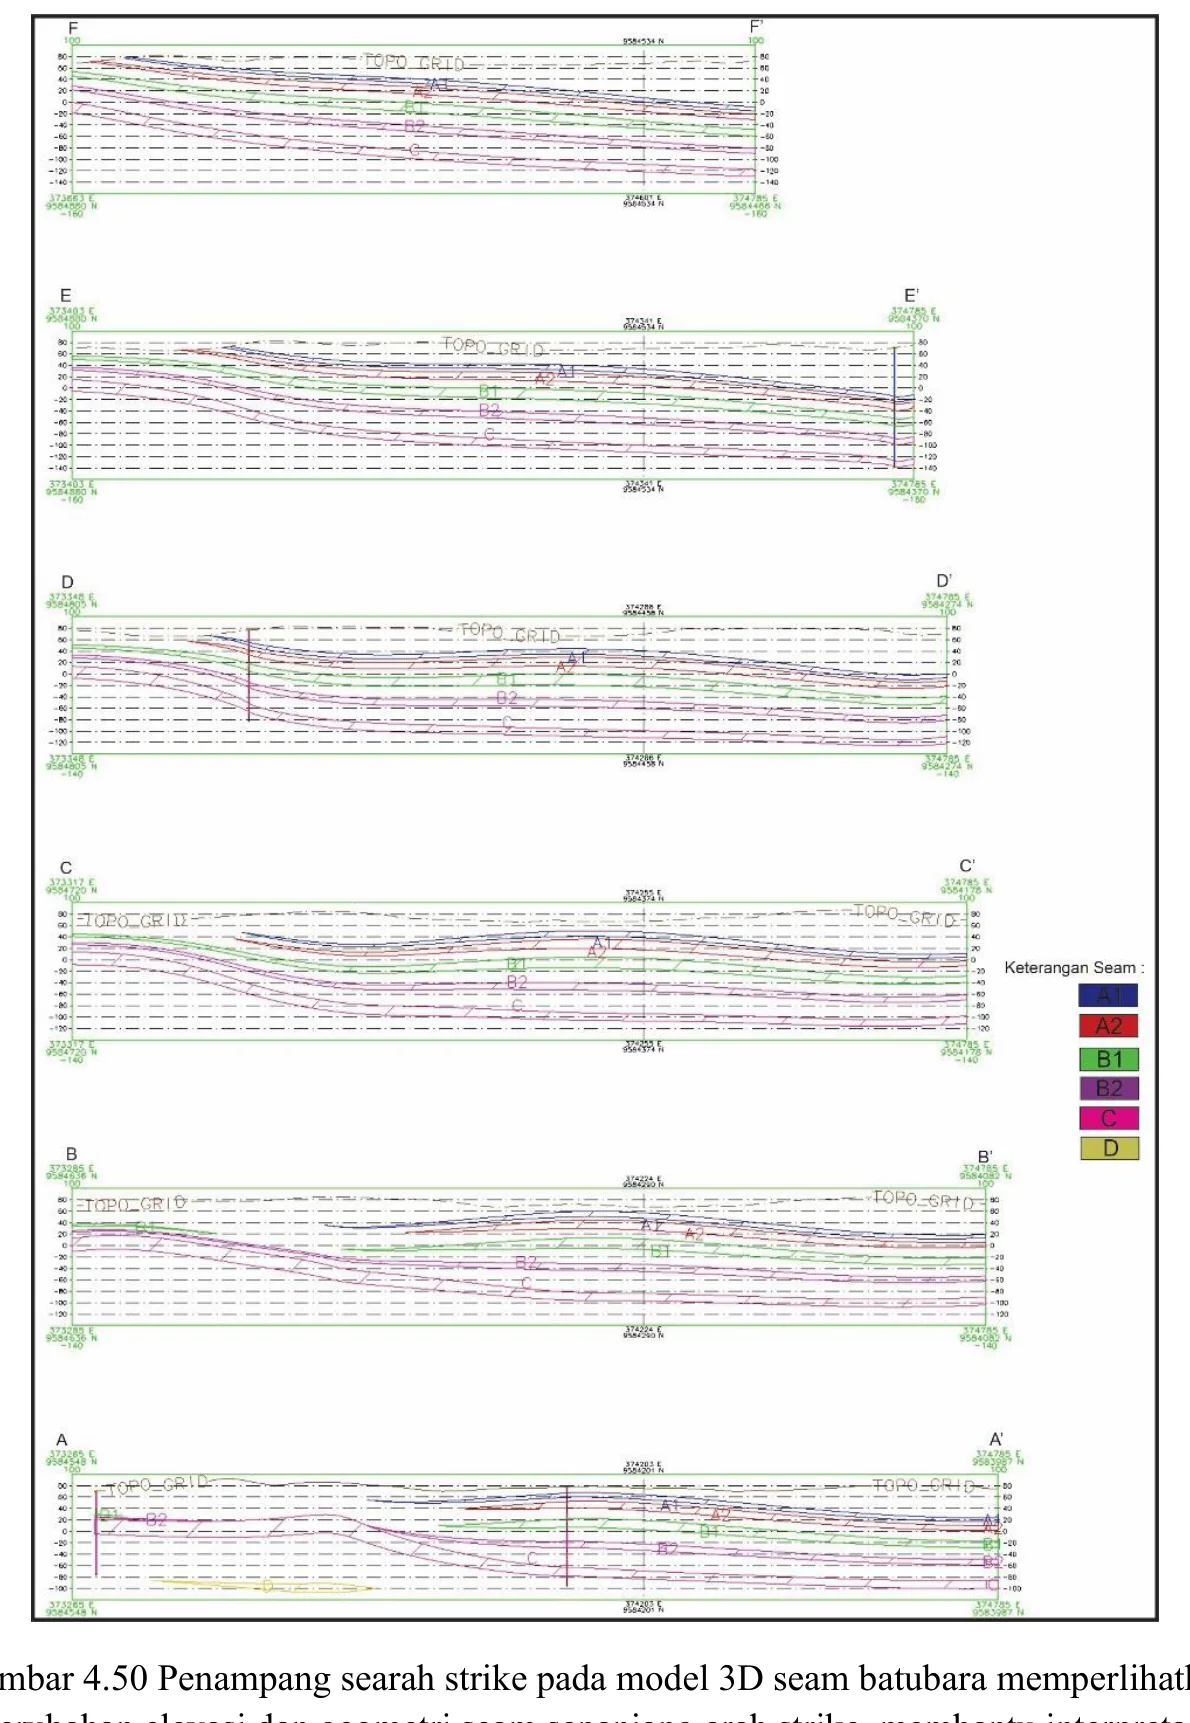
The section cuts through the three-dimensional seam surfaces to show their vertical and lateral relationships.

The section cuts through the three-dimensional seam surfaces to show their vertical and lateral relationships.