petrel-093838
Project data organization
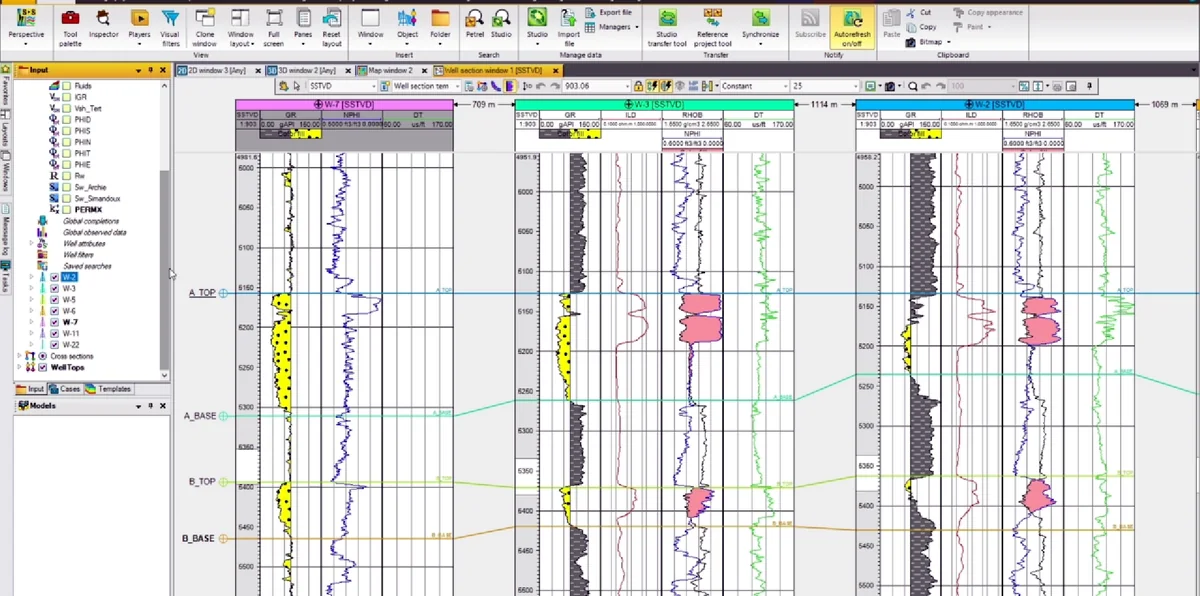
Stage 01 of the Petrel sequence: the Petrel project tree and well-section window are organised so that logs, markers, facies tracks and model objects can be reviewed from a single correlation workspace.
ALBUM
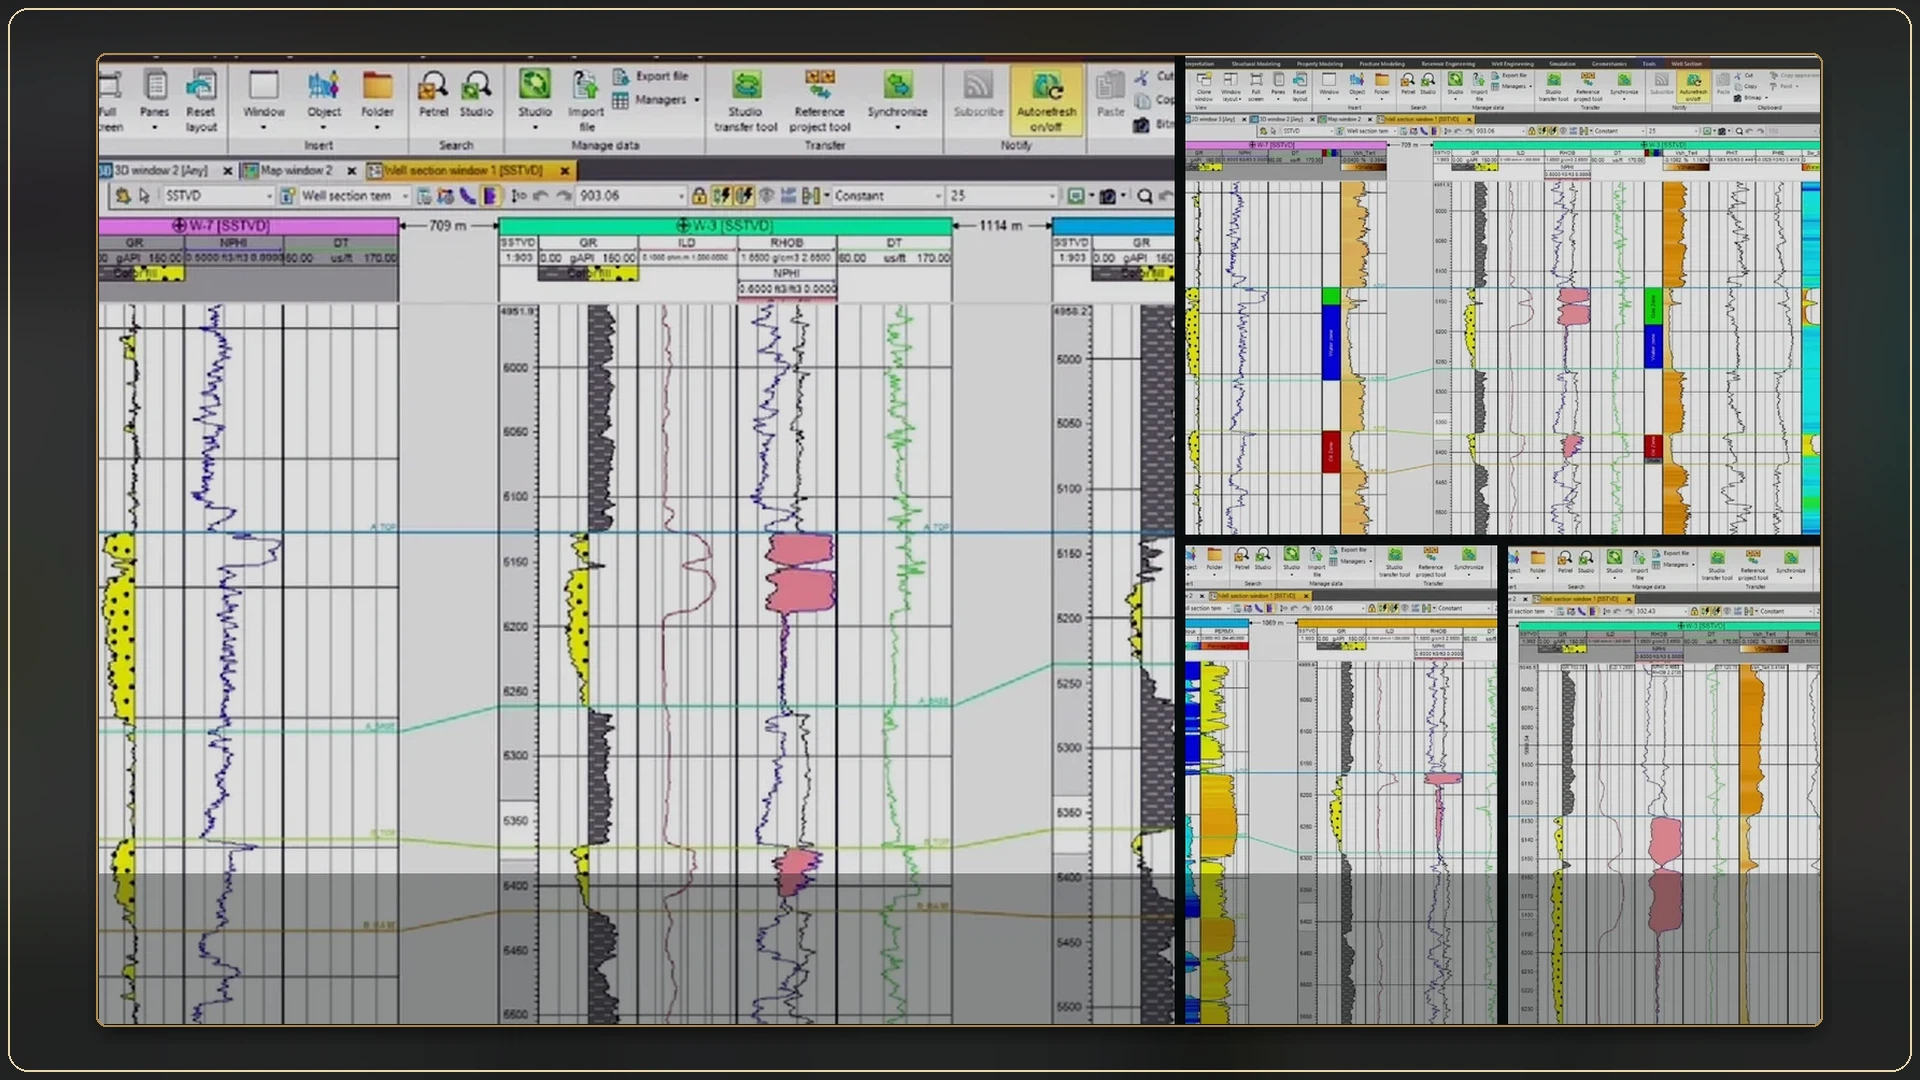
All 55 records are shown below.
Stage 01 of the Petrel sequence: the Petrel project tree and well-section window are organised so that logs, markers, facies tracks and model objects can be reviewed from a single correlation workspace.
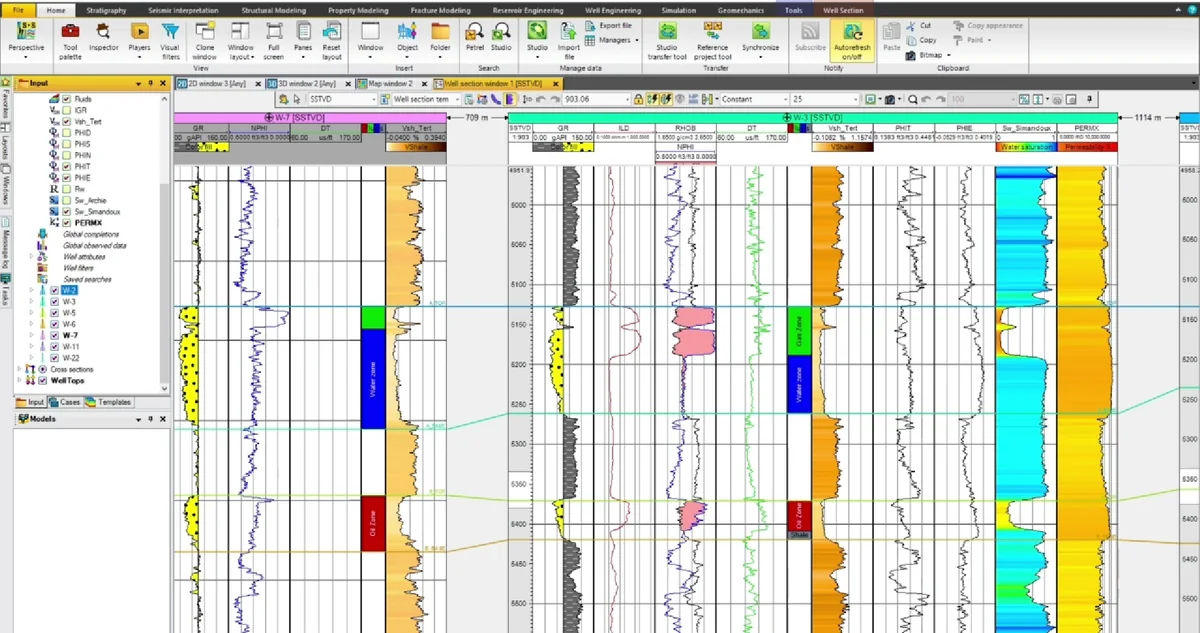
Stage 02 of the Petrel sequence: gamma-ray, density, lithology and interpreted tracks are arranged at a common vertical scale for direct comparison.
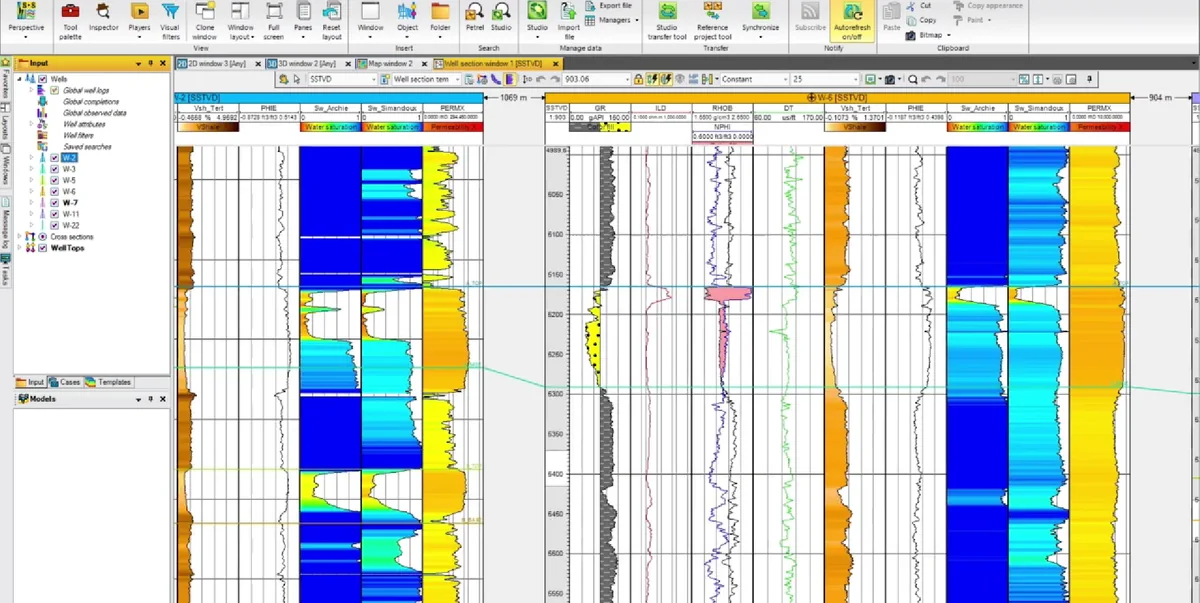
Stage 03 of the Petrel sequence: multiple wells are aligned in one correlation panel, with markers and interpreted intervals connected across the section.
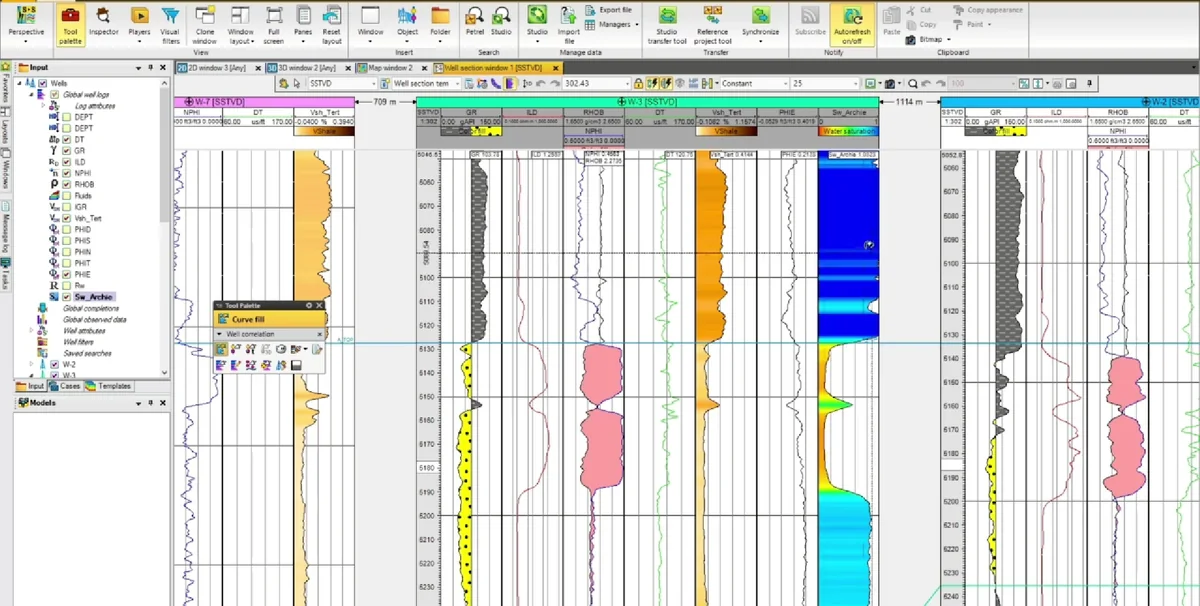
Stage 04 of the Petrel sequence: log curves, marker picks and interval boundaries are adjusted at well scale while neighbouring wells remain visible for control.
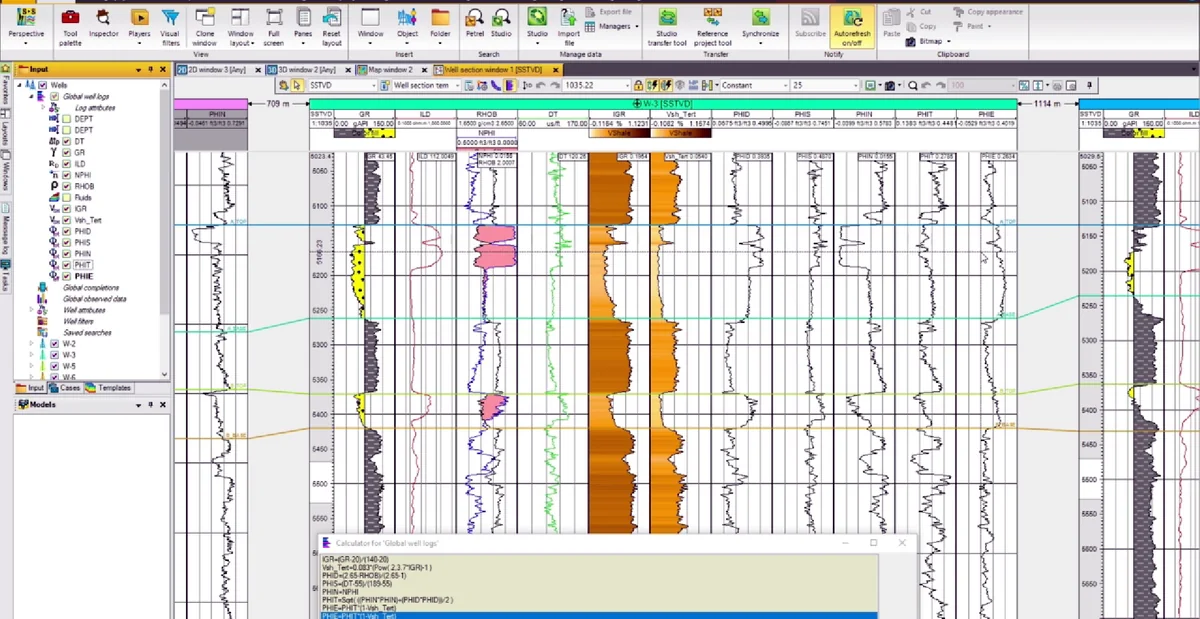
Stage 05 of the Petrel sequence: log curves, marker picks and interval boundaries are adjusted at well scale while neighbouring wells remain visible for control.
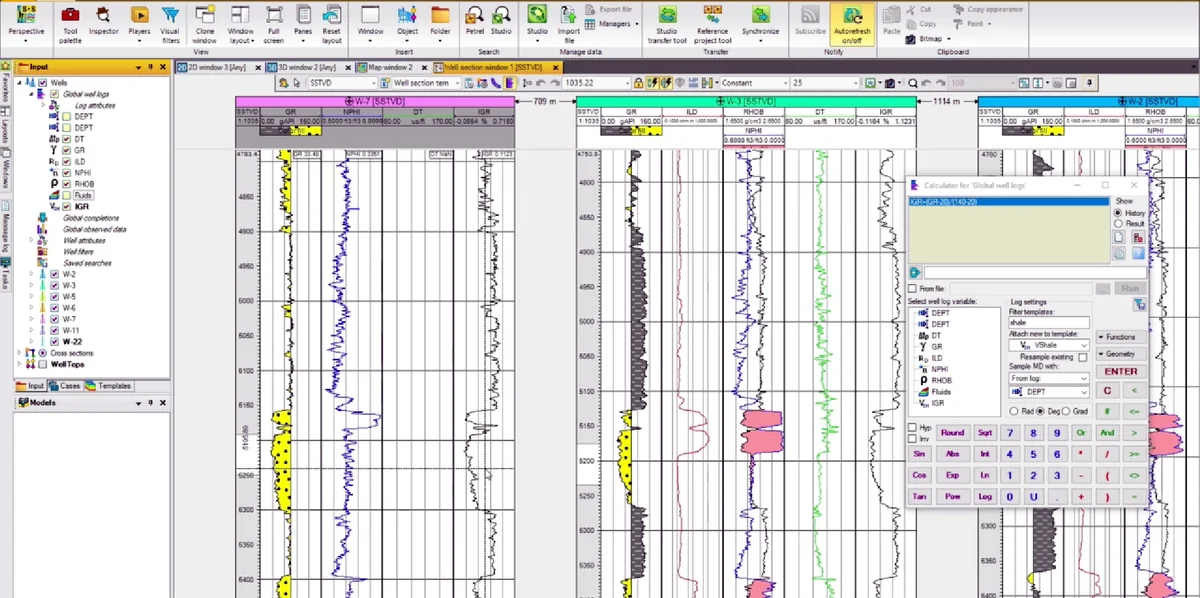
Stage 06 of the Petrel sequence: log curves, marker picks and interval boundaries are adjusted at well scale while neighbouring wells remain visible for control.
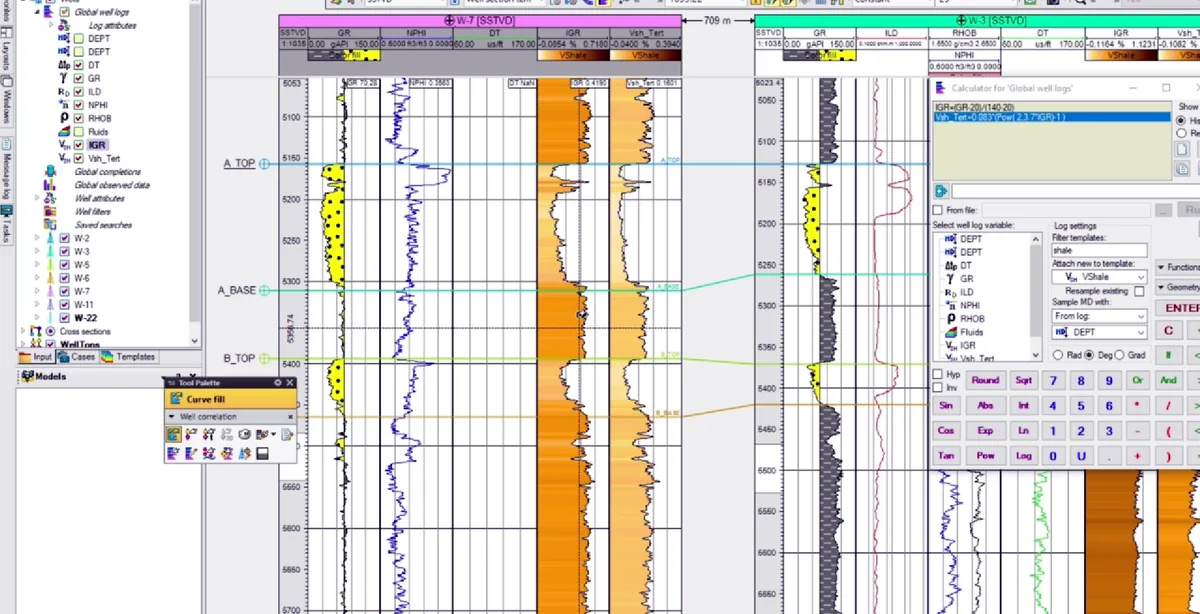
Stage 07 of the Petrel sequence: colour-coded electrofacies or property tracks are inspected beside the wireline logs and correlated markers.
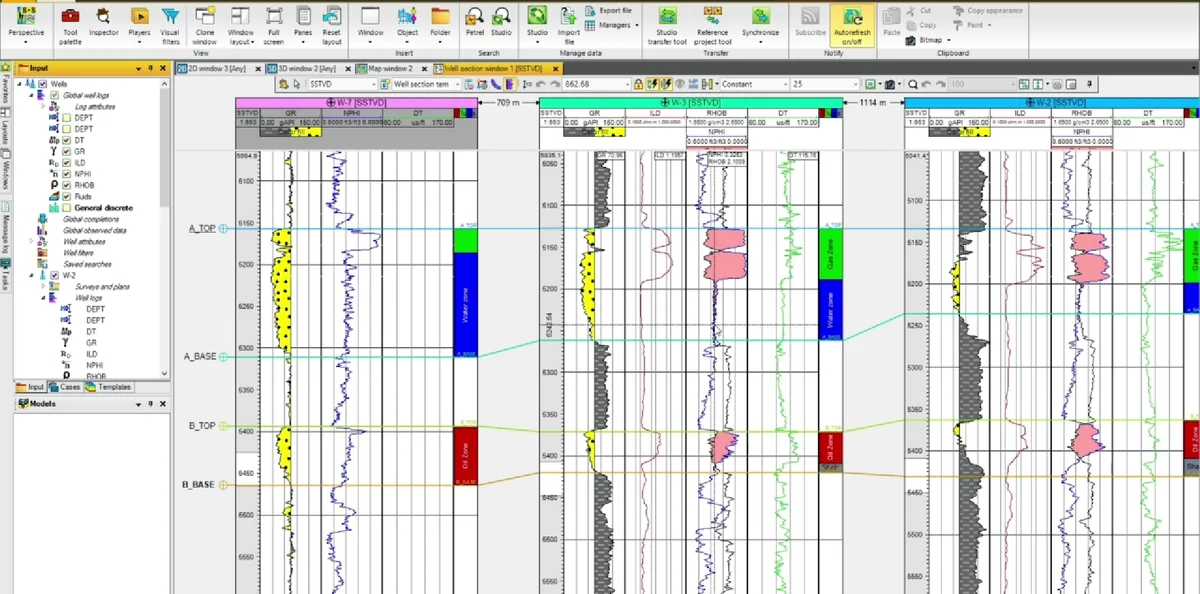
Stage 08 of the Petrel sequence: multiple wells are aligned in one correlation panel, with markers and interpreted intervals connected across the section.
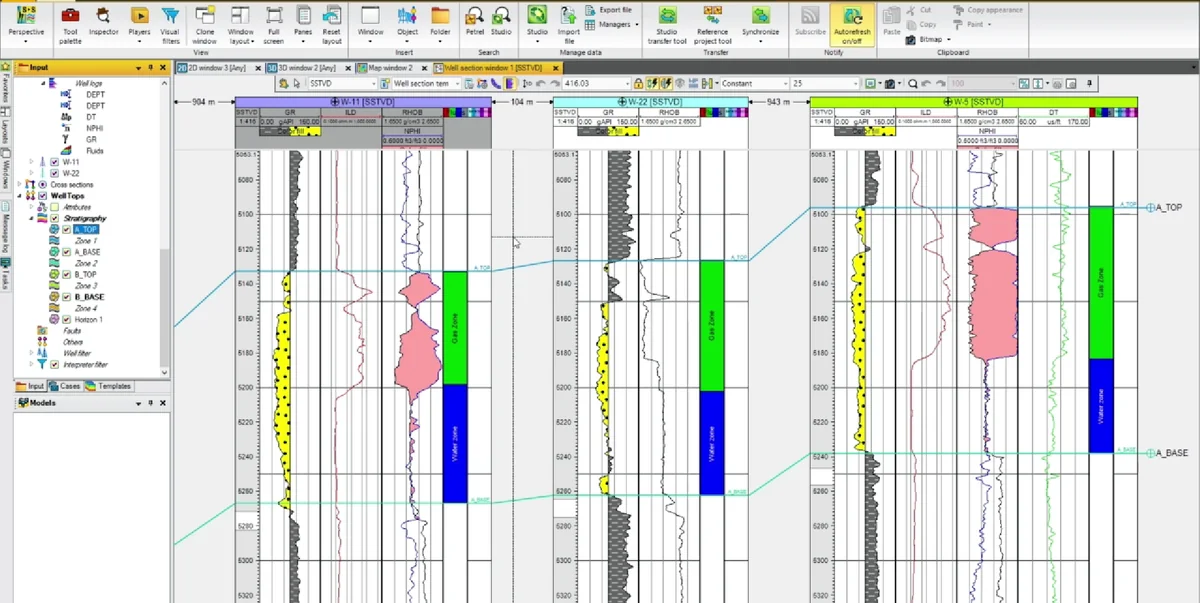
Stage 09 of the Petrel sequence: colour-coded electrofacies or property tracks are inspected beside the wireline logs and correlated markers.
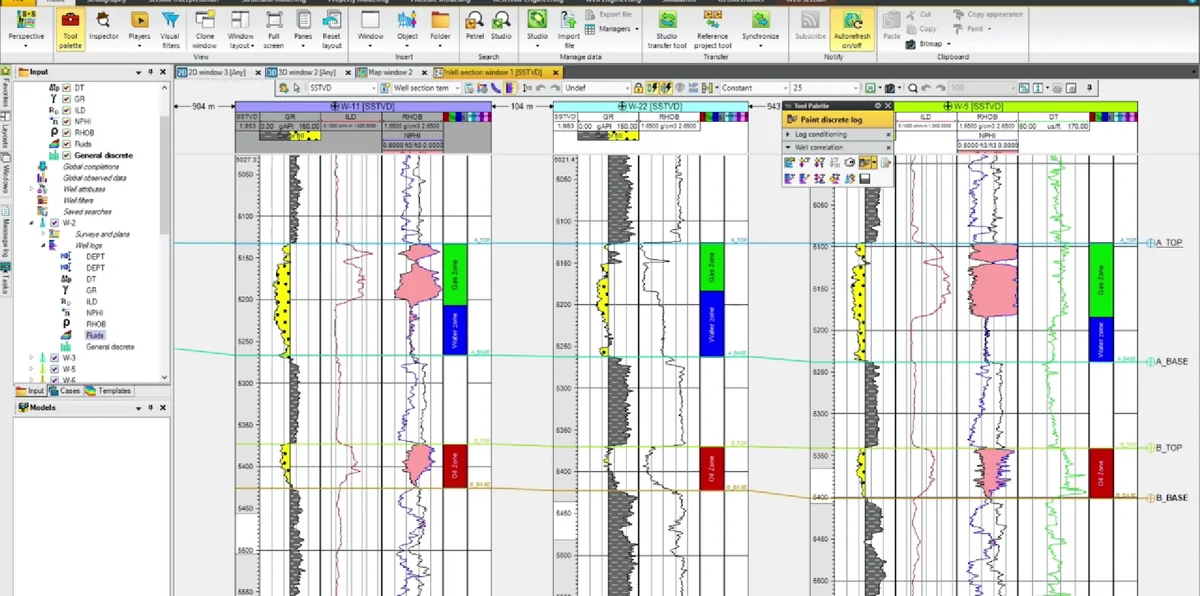
Stage 10 of the Petrel sequence: multiple wells are aligned in one correlation panel, with markers and interpreted intervals connected across the section.
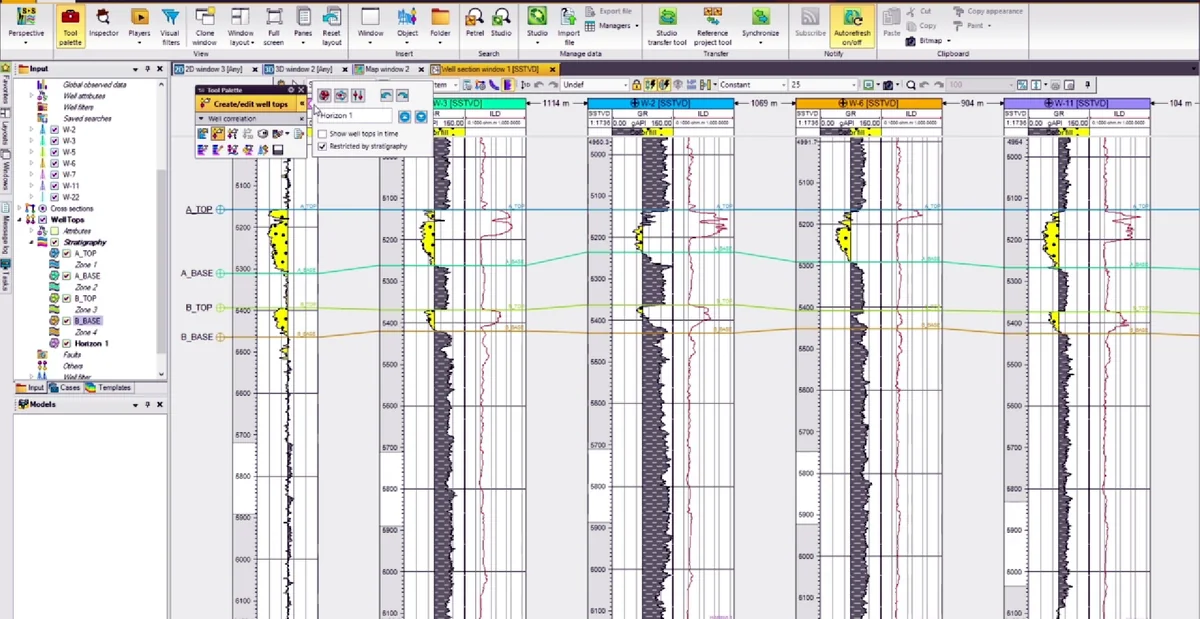
Stage 11 of the Petrel sequence: the correlated wells are positioned within a three-dimensional structural context to check the spatial relationship between the section and the model framework.
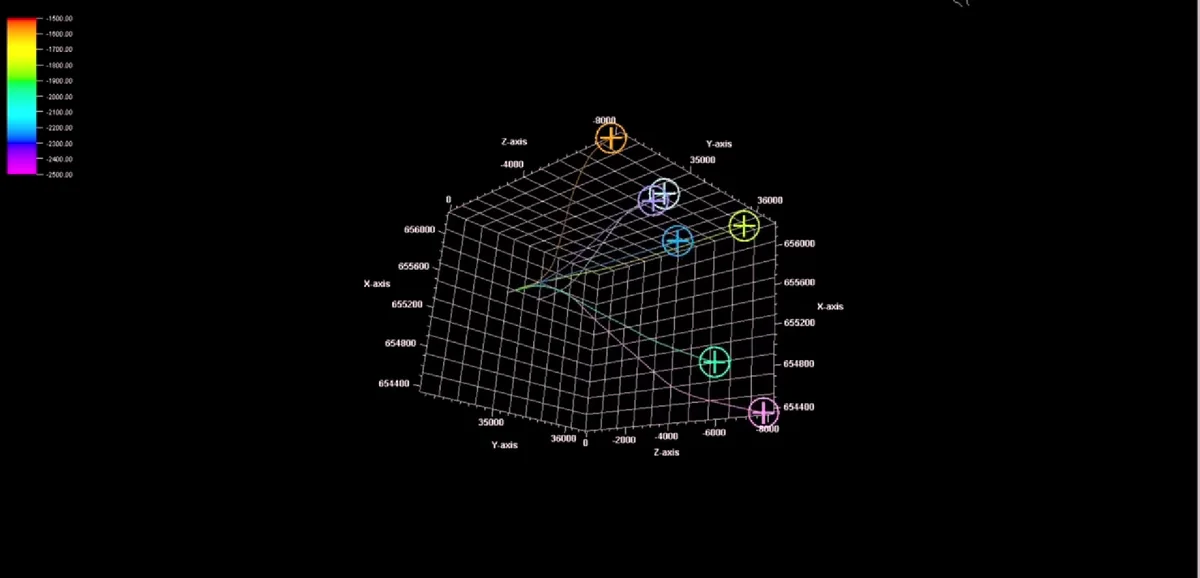
Stage 12 of the Petrel sequence: a three-dimensional surface or horizon object is isolated to inspect its geometry relative to the available well control.
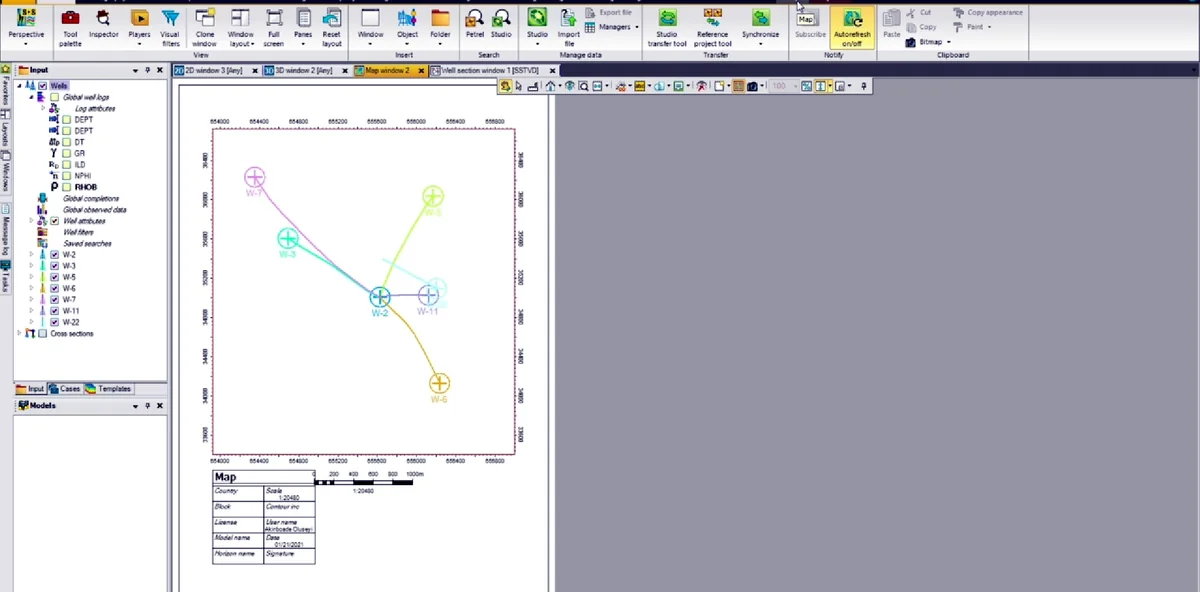
Stage 13 of the Petrel sequence: a diagnostic plot and project controls are used to review the consistency of the interpreted model against the available data.
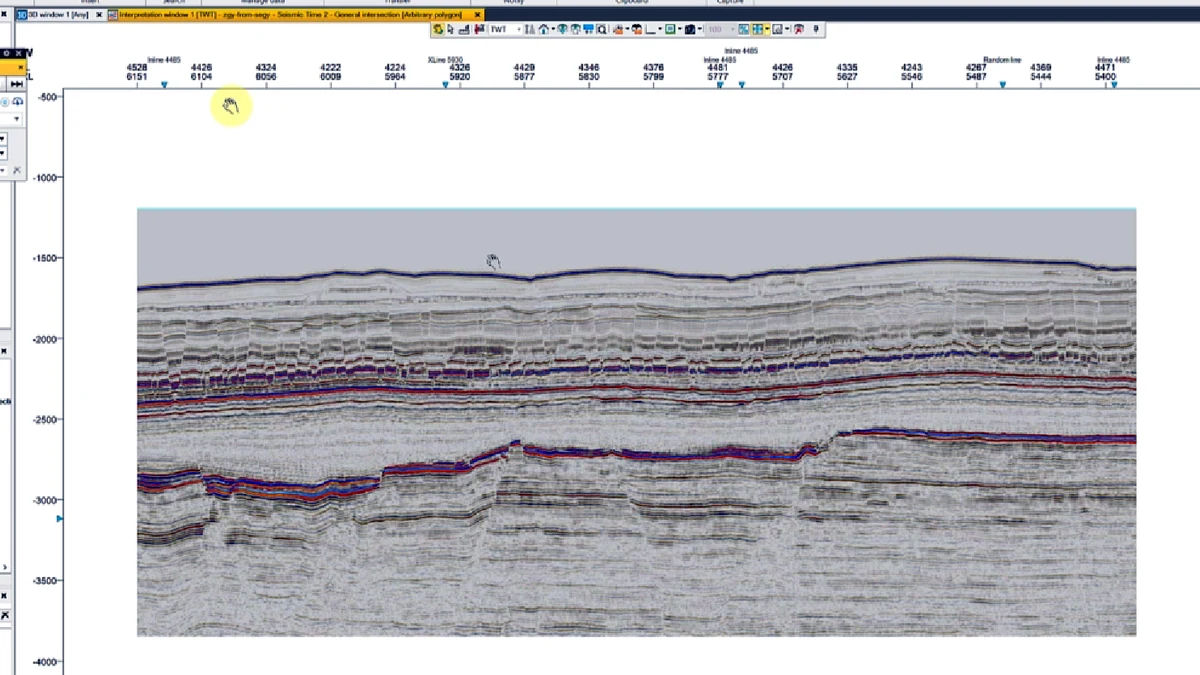
Stage 14 of the Petrel sequence: a vertical seismic section carries several interpreted horizons, allowing reflector continuity and structural relief to be followed along one line.
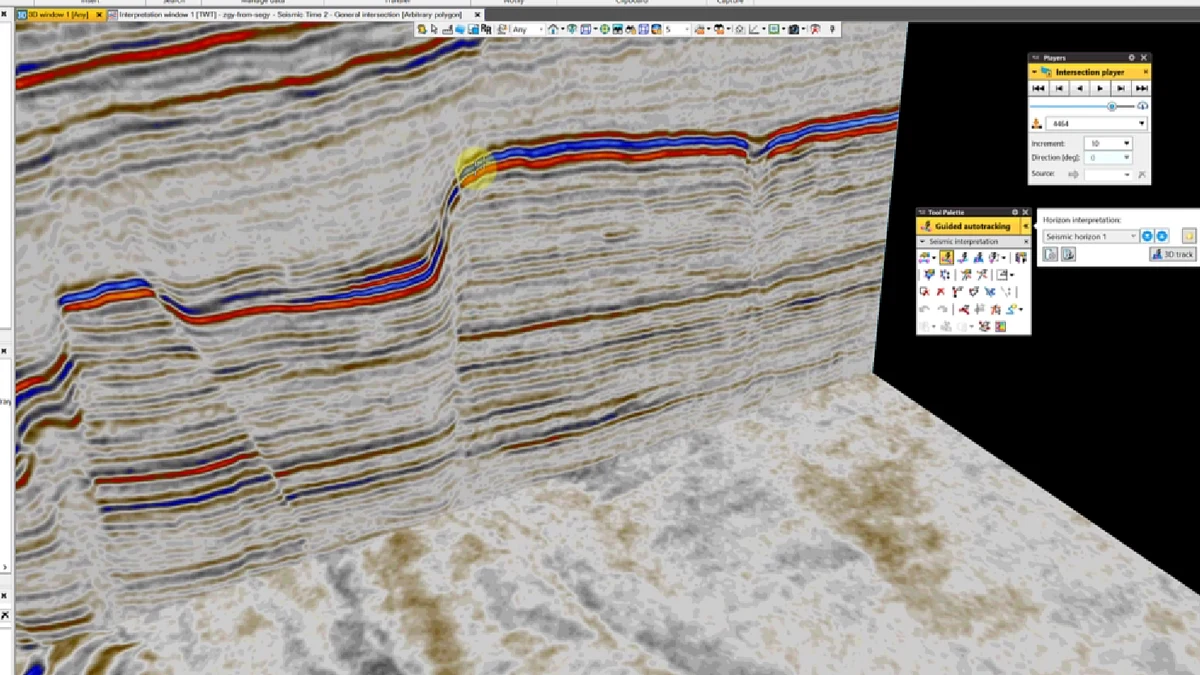
Stage 15 of the Petrel sequence: intersecting seismic panels display the same interpreted horizons from different directions, exposing misties and inconsistent picks at line intersections.
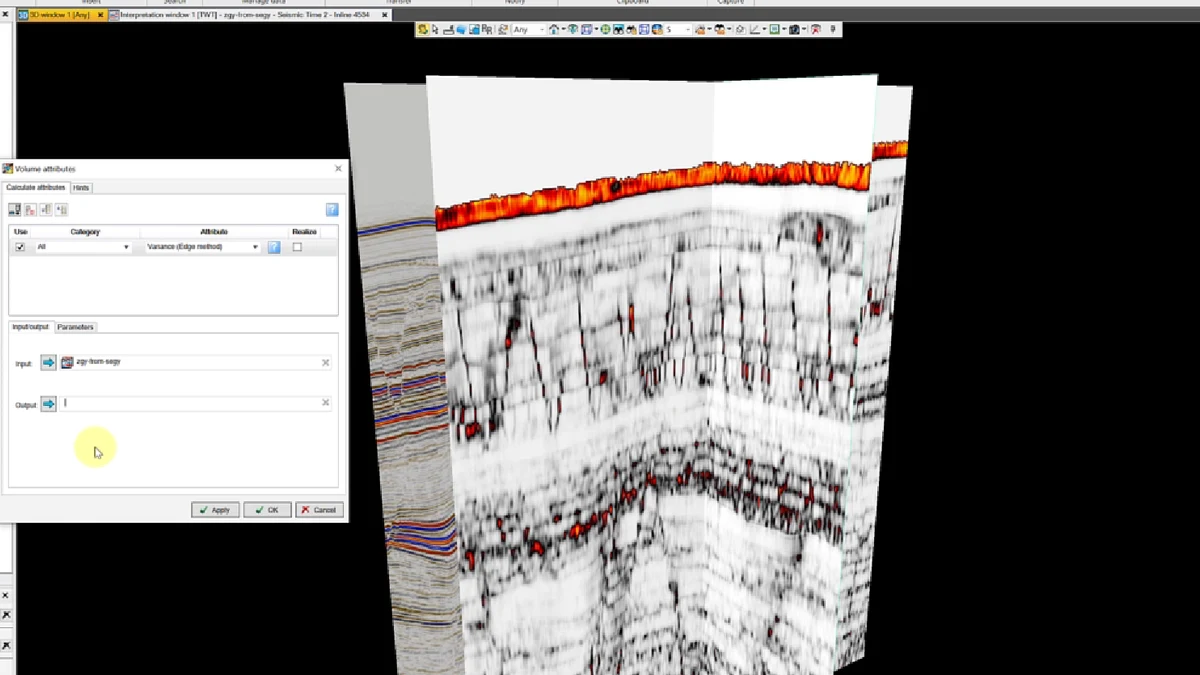
Stage 16 of the Petrel sequence: intersecting seismic panels display the same interpreted horizons from different directions, exposing misties and inconsistent picks at line intersections.
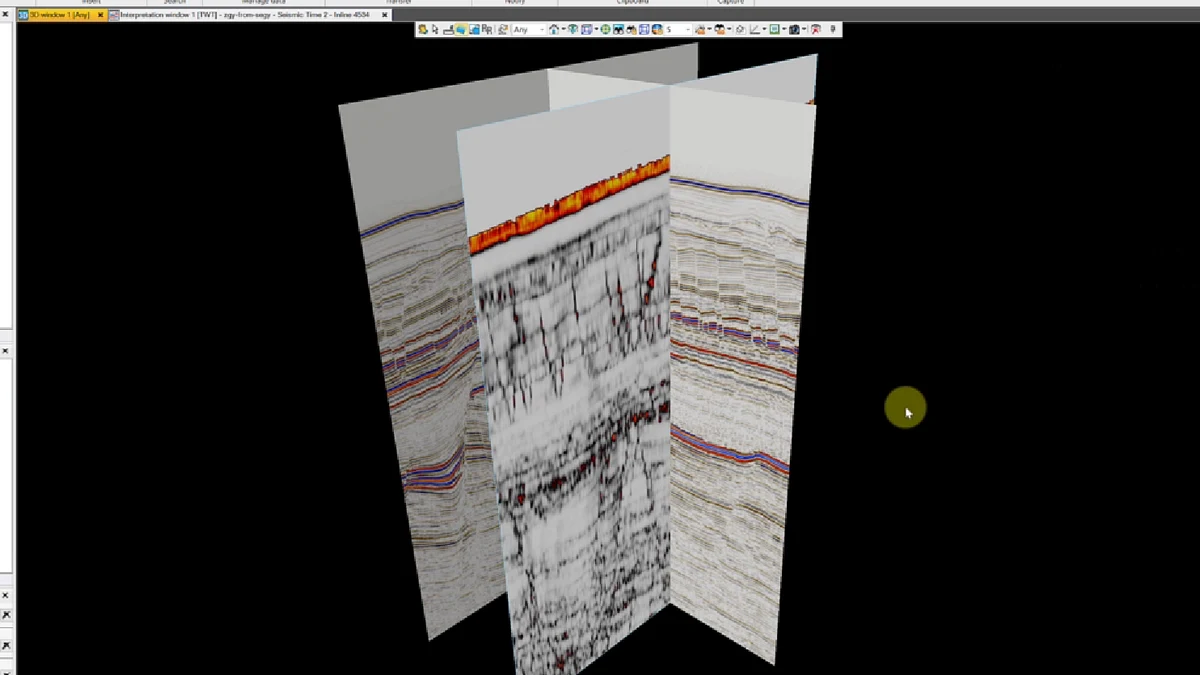
Stage 17 of the Petrel sequence: intersecting seismic panels display the same interpreted horizons from different directions, exposing misties and inconsistent picks at line intersections.
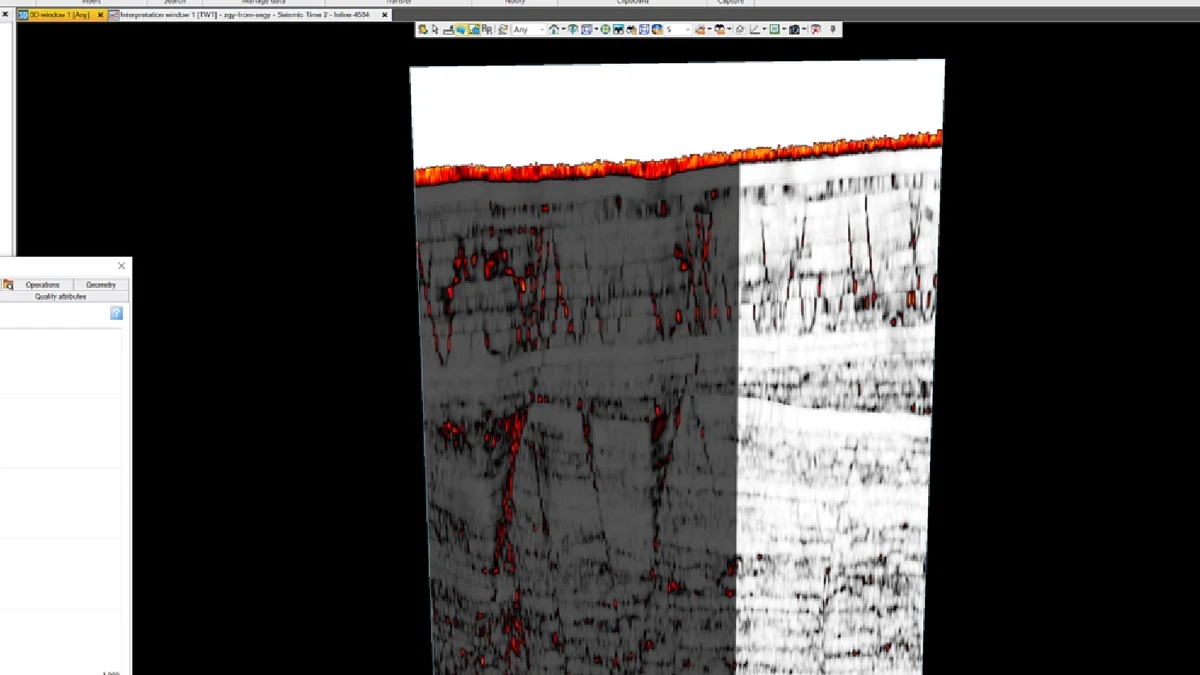
Stage 18 of the Petrel sequence: display opacity and colour controls are adjusted while the seismic volume and interpretation remain visible.
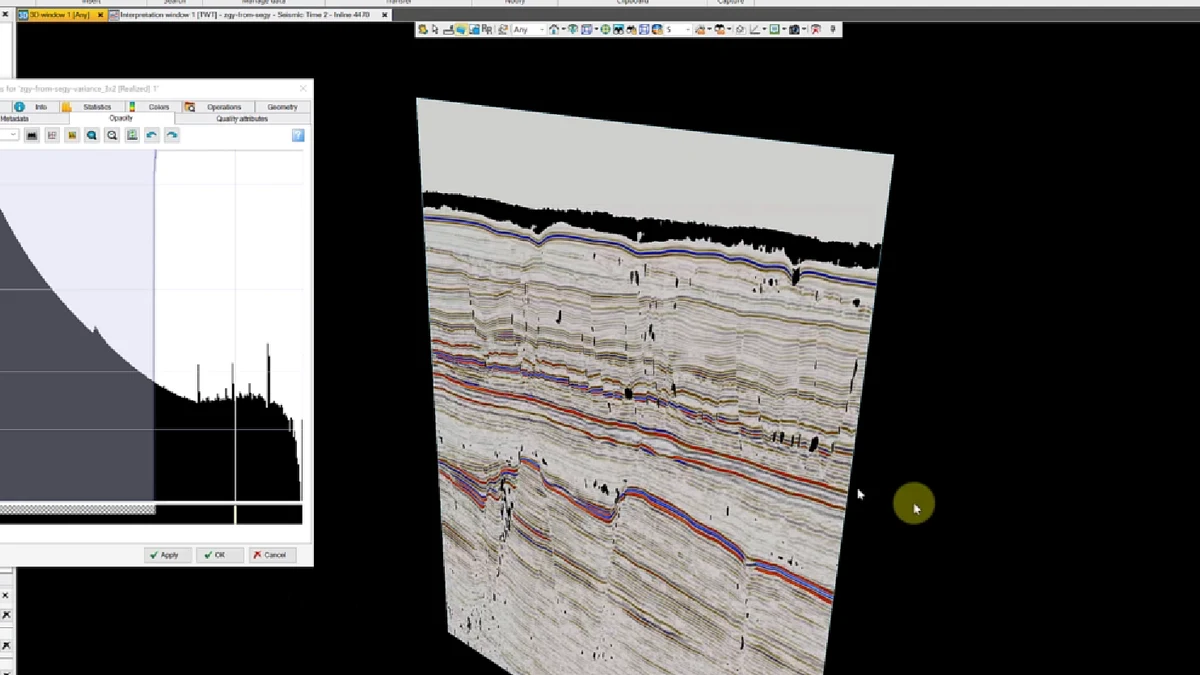
Stage 19 of the Petrel sequence: interpreted horizons are traced across a vertical seismic section, including intervals where reflector continuity is disrupted.
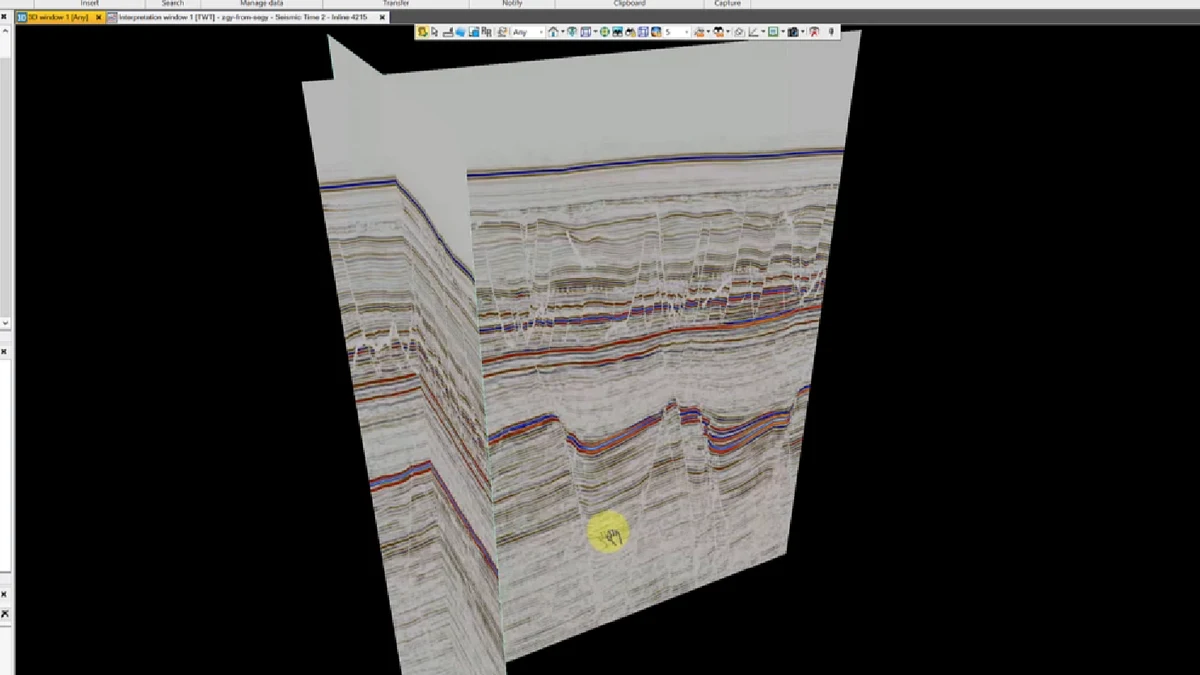
Stage 20 of the Petrel sequence: intersecting seismic panels display the same interpreted horizons from different directions, exposing misties and inconsistent picks at line intersections.
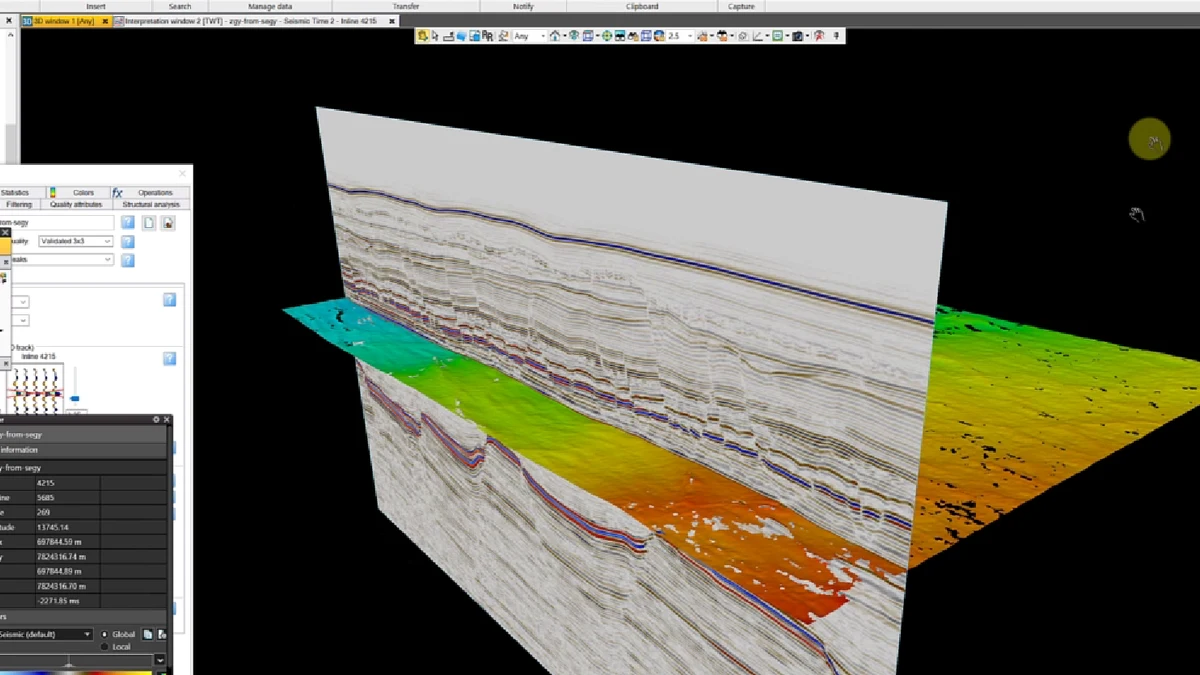
Stage 21 of the Petrel sequence: the interpreted horizon is converted to a colour-ramped surface and viewed together with the seismic control from which it was derived.
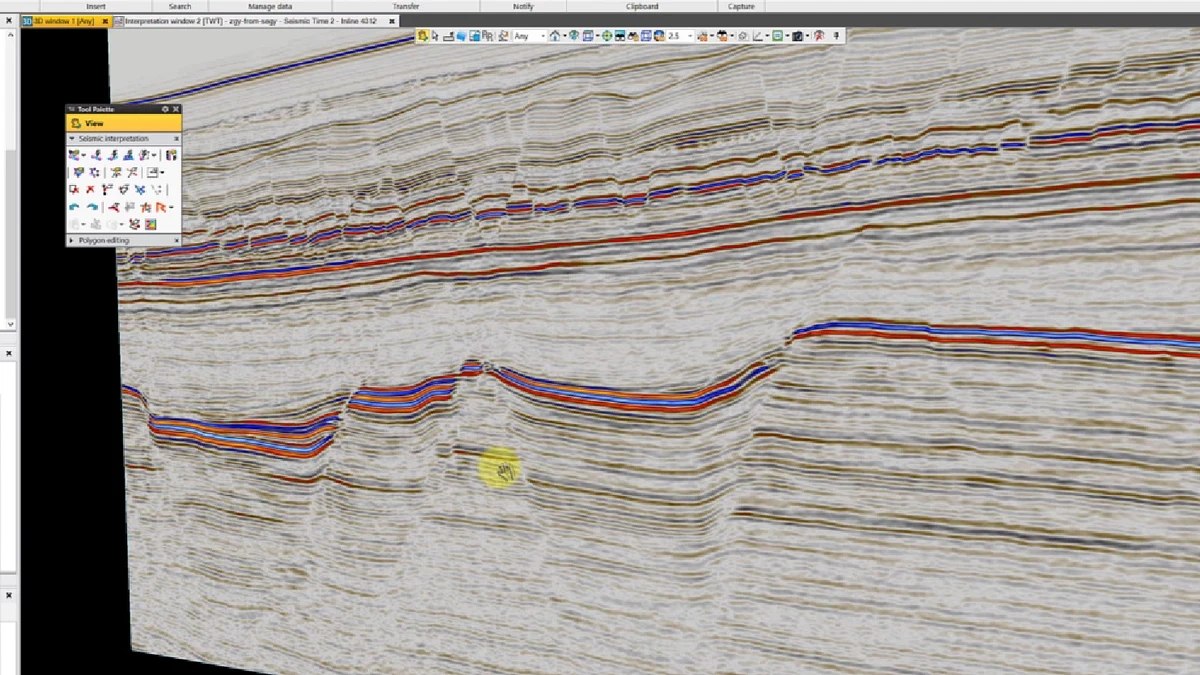
Stage 22 of the Petrel sequence: interpreted horizons are traced across a vertical seismic section, including intervals where reflector continuity is disrupted.
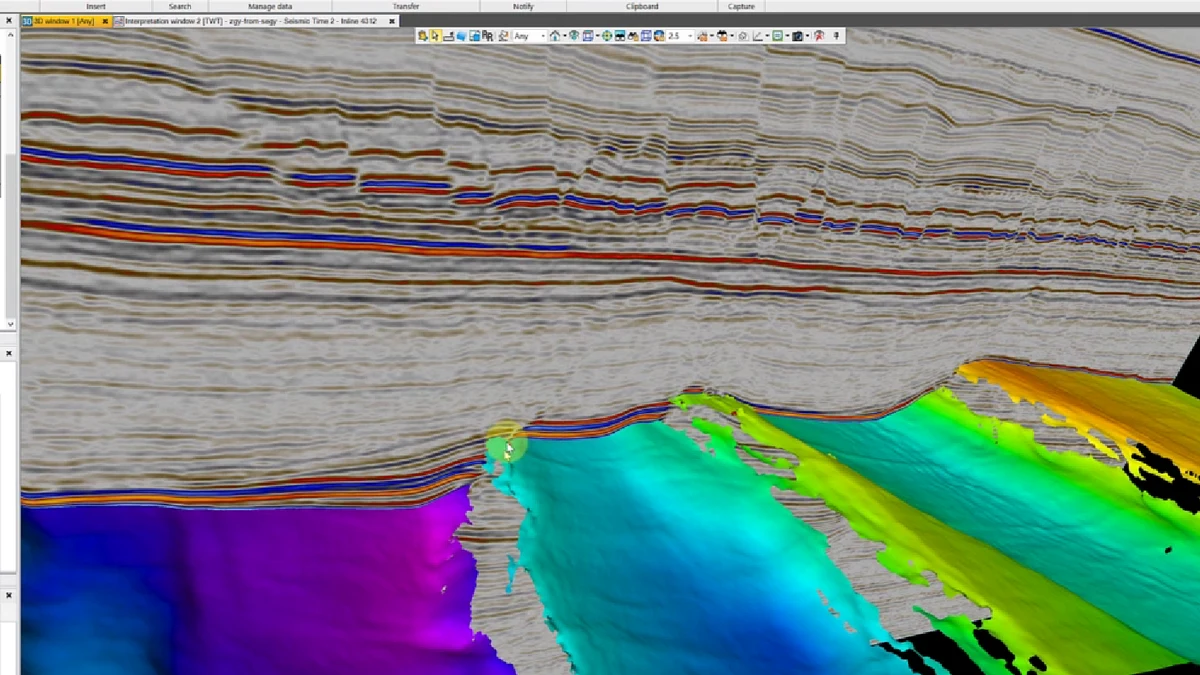
Stage 23 of the Petrel sequence: the interpreted horizon is converted to a colour-ramped surface and viewed together with the seismic control from which it was derived.
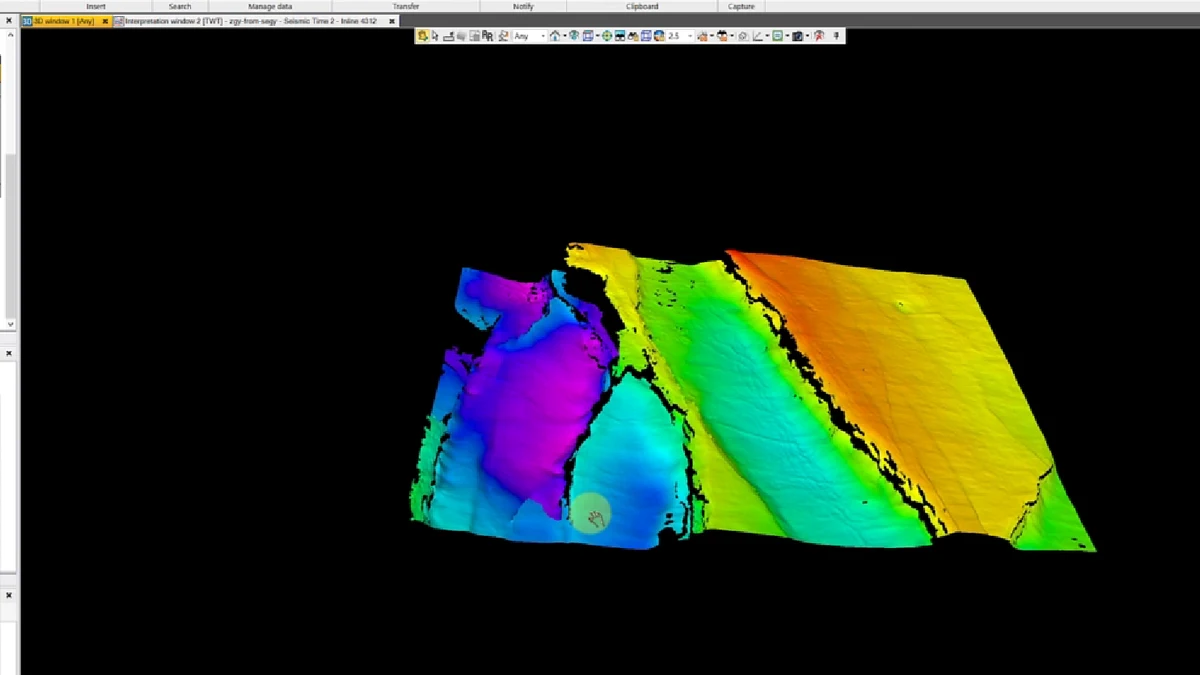
Stage 24 of the Petrel sequence: the interpreted horizon is converted to a colour-ramped surface and viewed together with the seismic control from which it was derived.
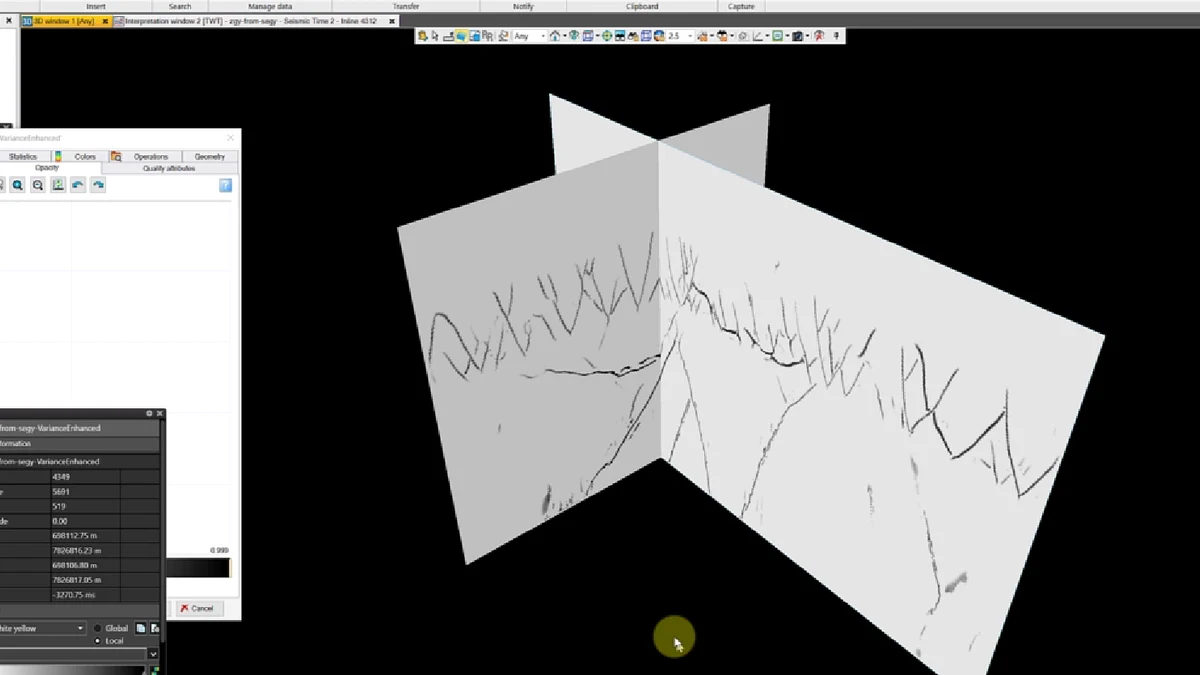
Stage 25 of the Petrel sequence: fault traces and fault sticks are displayed on orthogonal seismic panels, with horizon offsets providing structural control.
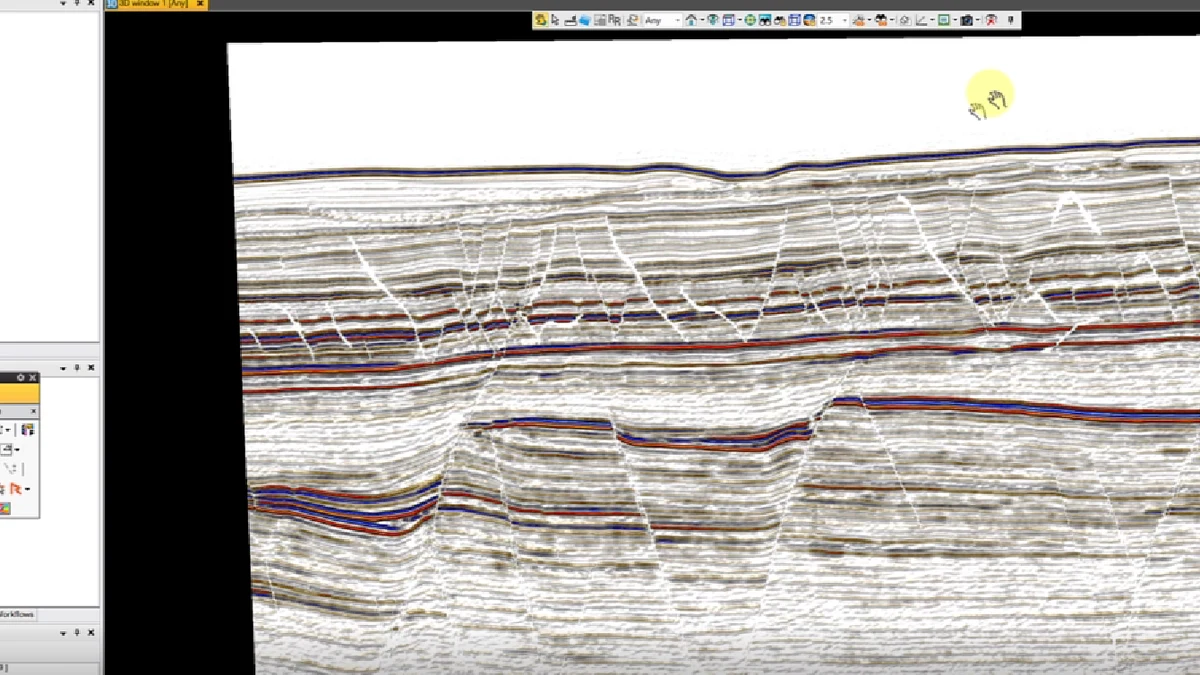
Stage 26 of the Petrel sequence: fault traces and fault sticks are displayed on orthogonal seismic panels, with horizon offsets providing structural control.
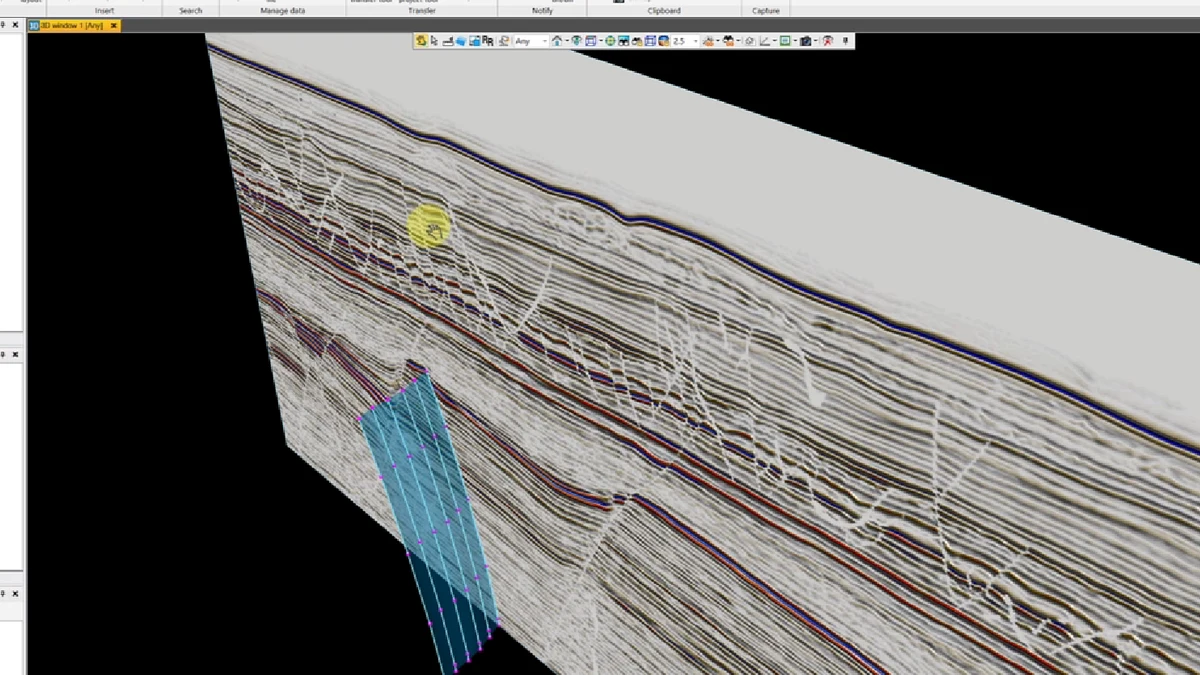
Stage 27 of the Petrel sequence: a single fault surface is positioned against the seismic and horizon framework to review its dip, extent and intersection geometry.
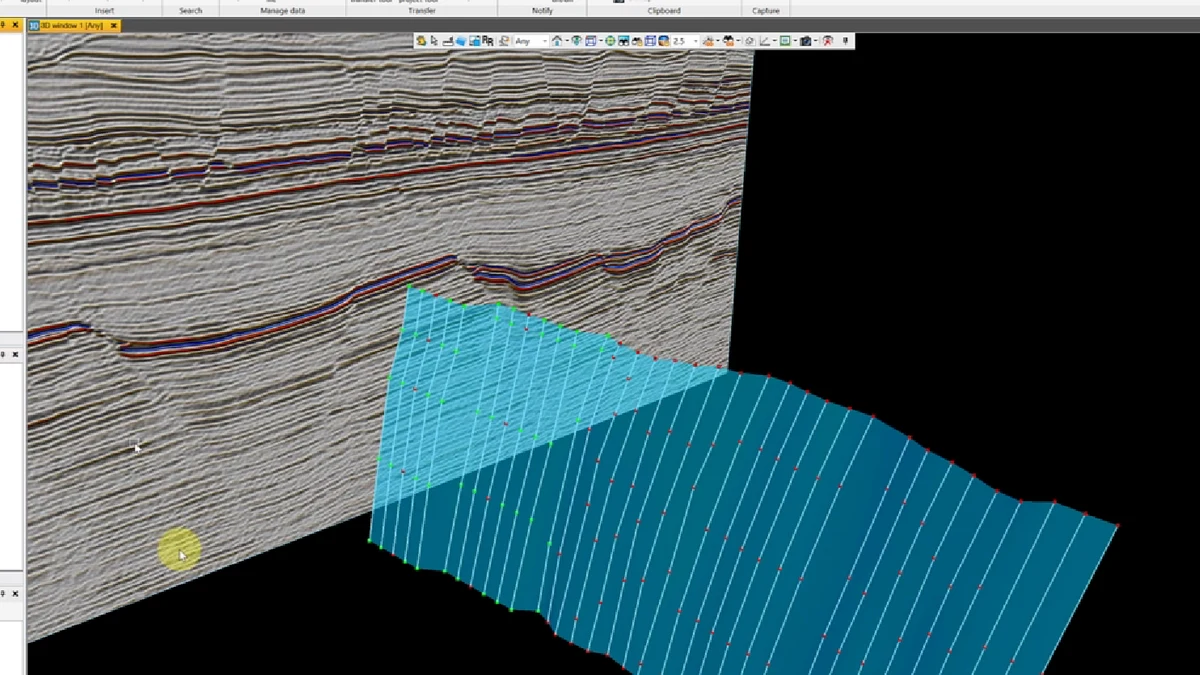
Stage 28 of the Petrel sequence: a single fault surface is positioned against the seismic and horizon framework to review its dip, extent and intersection geometry.
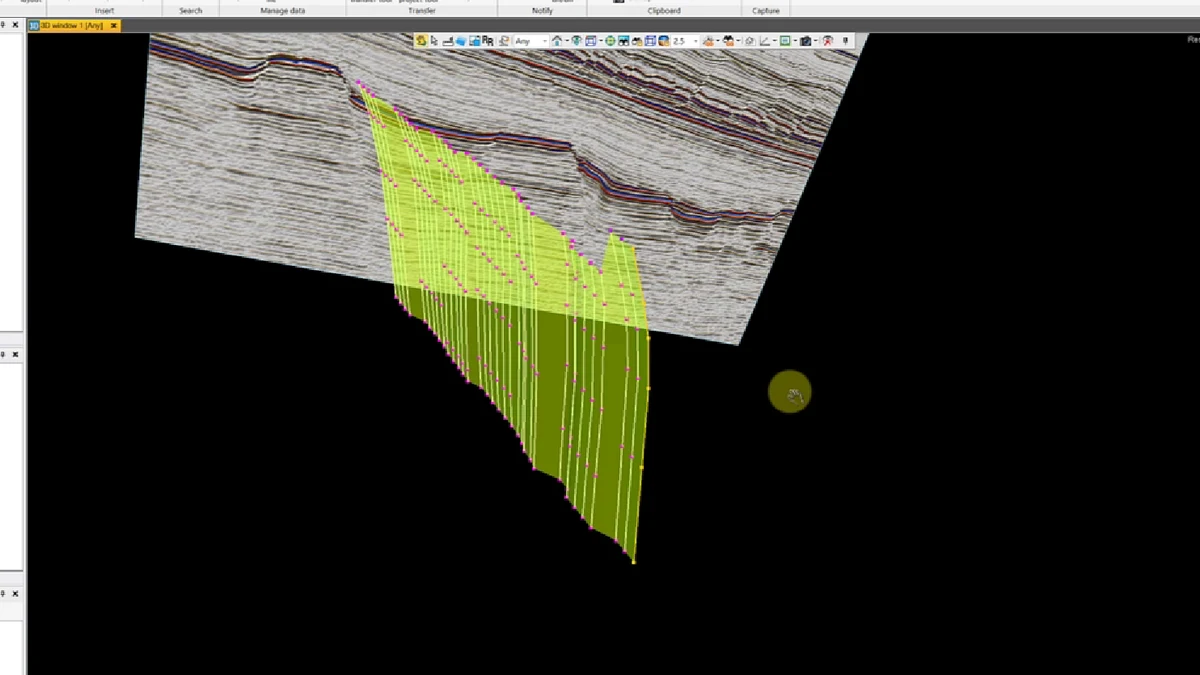
Stage 29 of the Petrel sequence: a single fault surface is positioned against the seismic and horizon framework to review its dip, extent and intersection geometry.
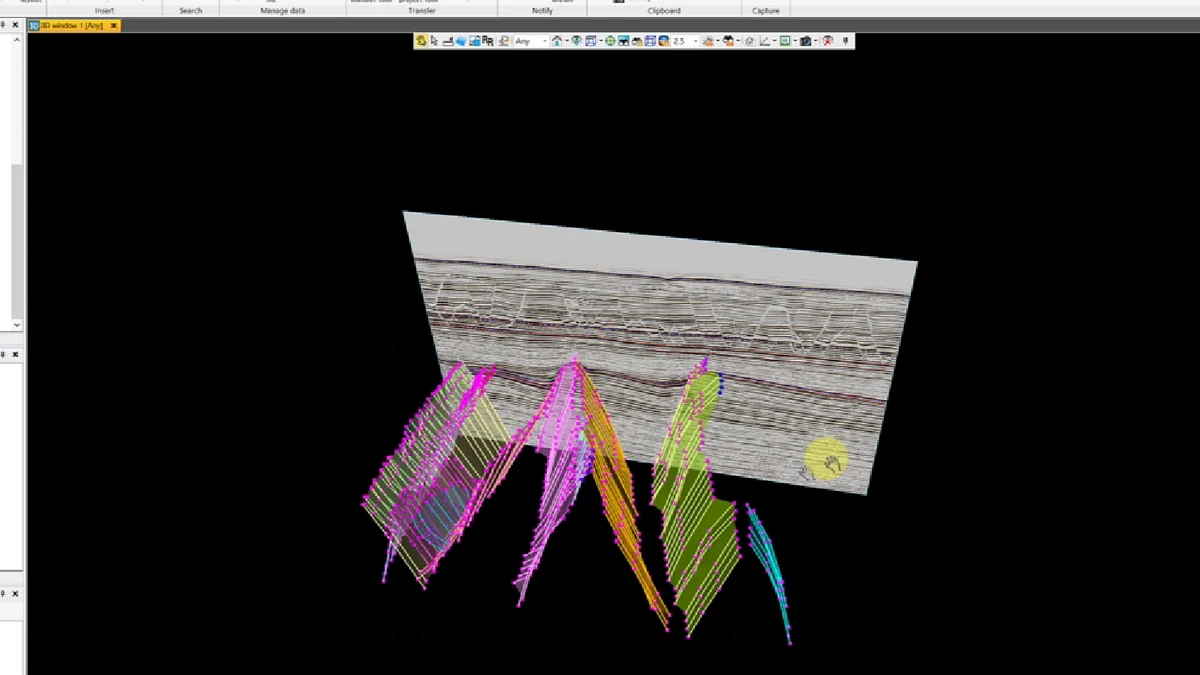
Stage 30 of the Petrel sequence: multiple fault-stick sets are assembled in three dimensions, revealing segmentation, overlap and the structural density of the interpreted network.
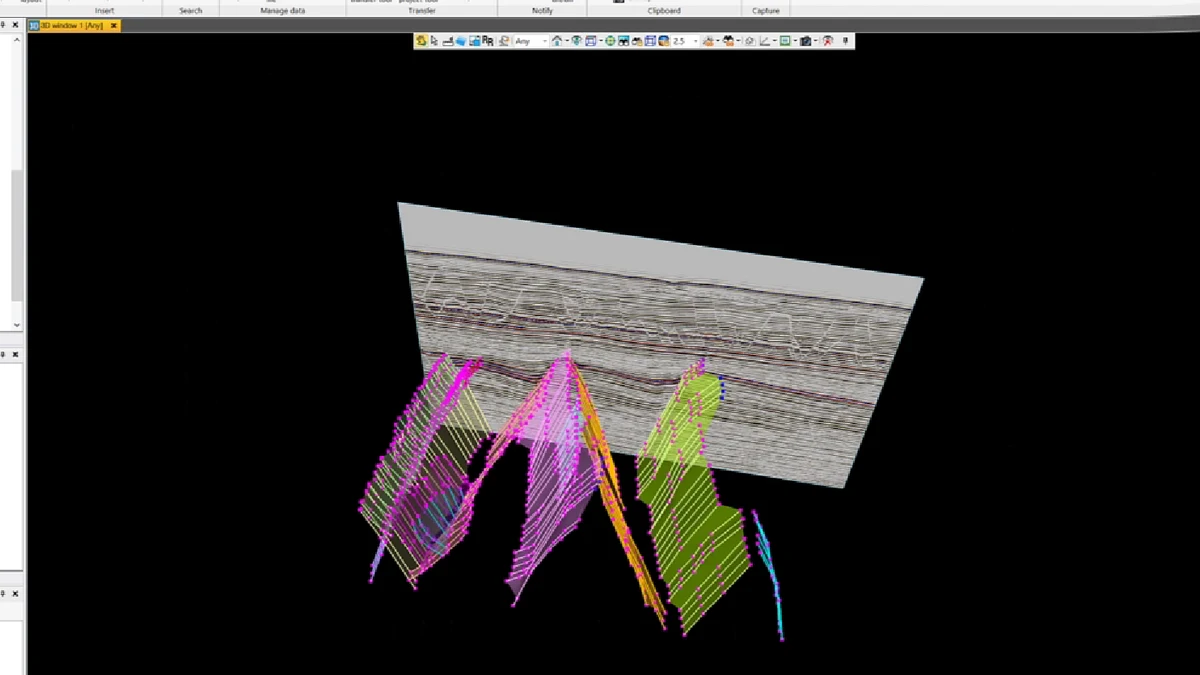
Stage 31 of the Petrel sequence: multiple fault-stick sets are assembled in three dimensions, revealing segmentation, overlap and the structural density of the interpreted network.
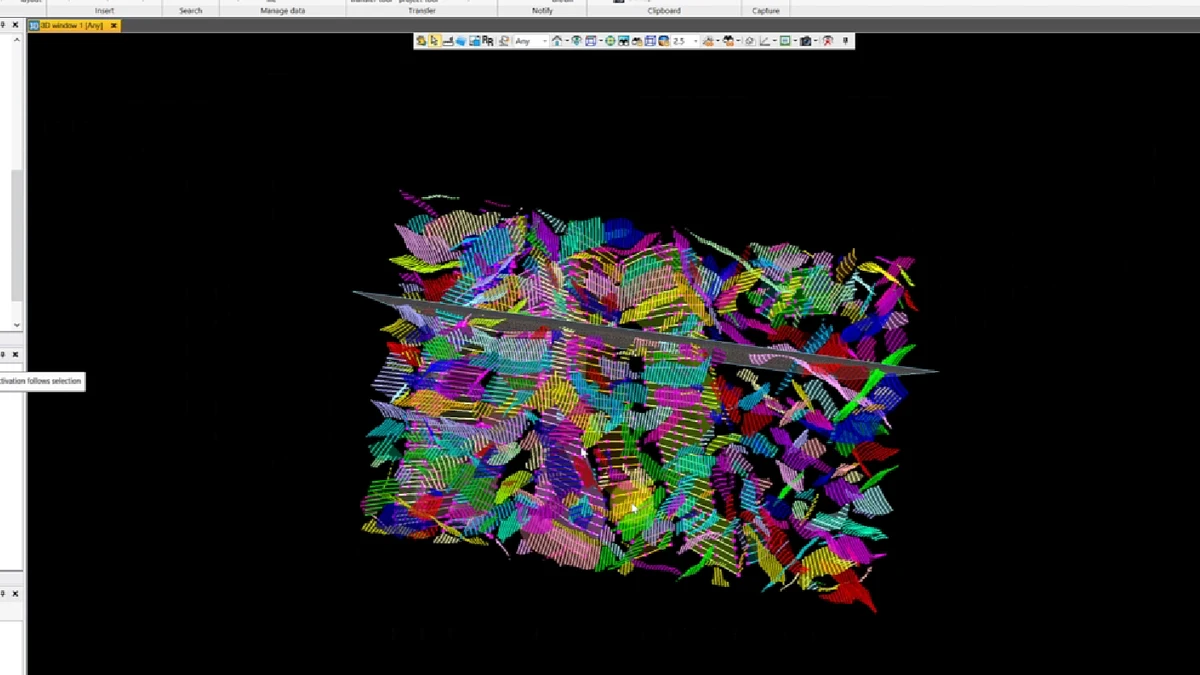
Stage 32 of the Petrel sequence: multiple fault-stick sets are assembled in three dimensions, revealing segmentation, overlap and the structural density of the interpreted network.
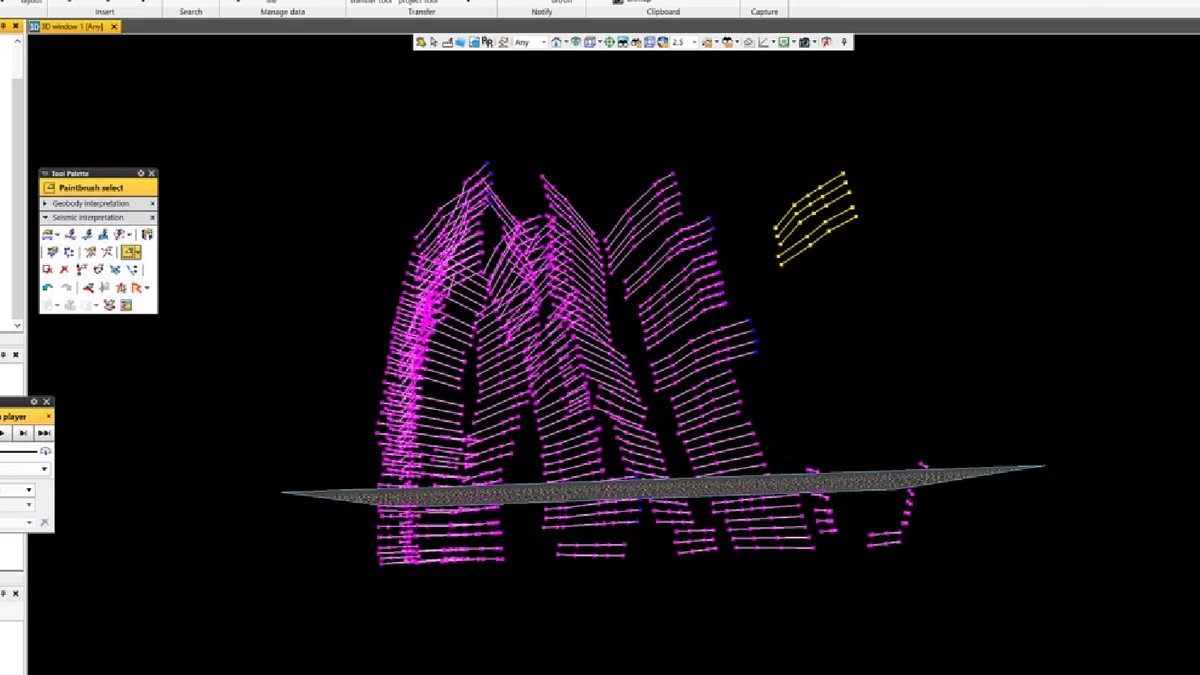
Stage 33 of the Petrel sequence: multiple fault-stick sets are assembled in three dimensions, revealing segmentation, overlap and the structural density of the interpreted network.
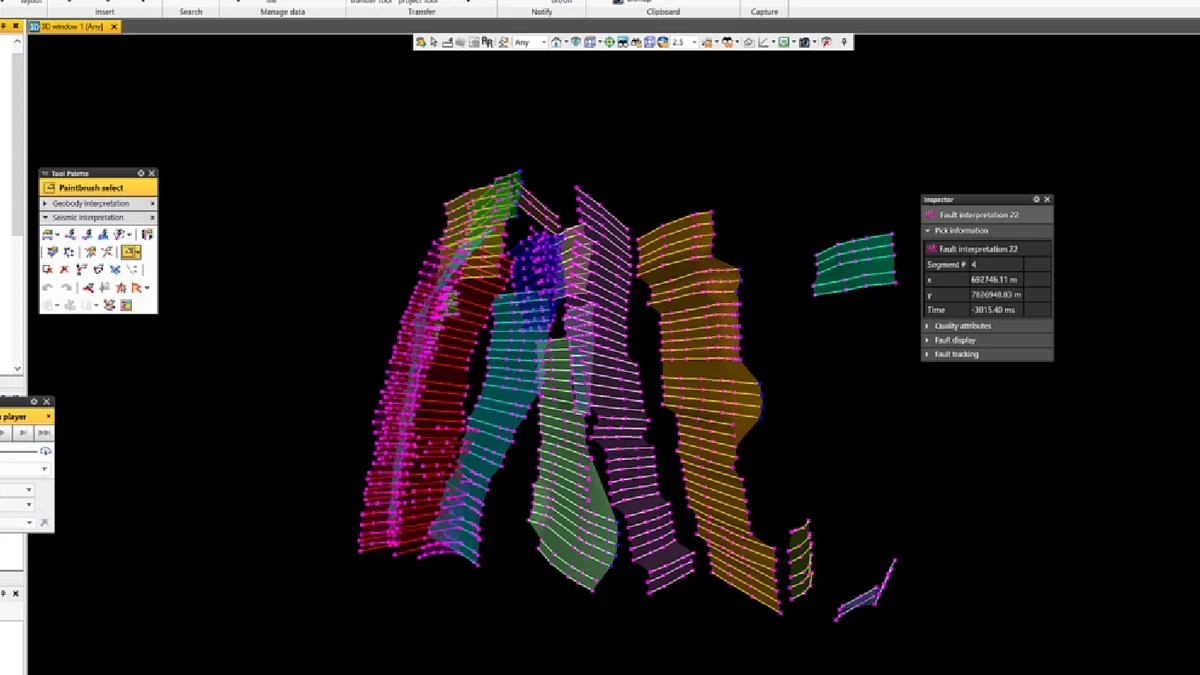
Stage 34 of the Petrel sequence: colour-coded fault surfaces have been generated from the interpreted stick sets, allowing individual structures and intersections to be distinguished.
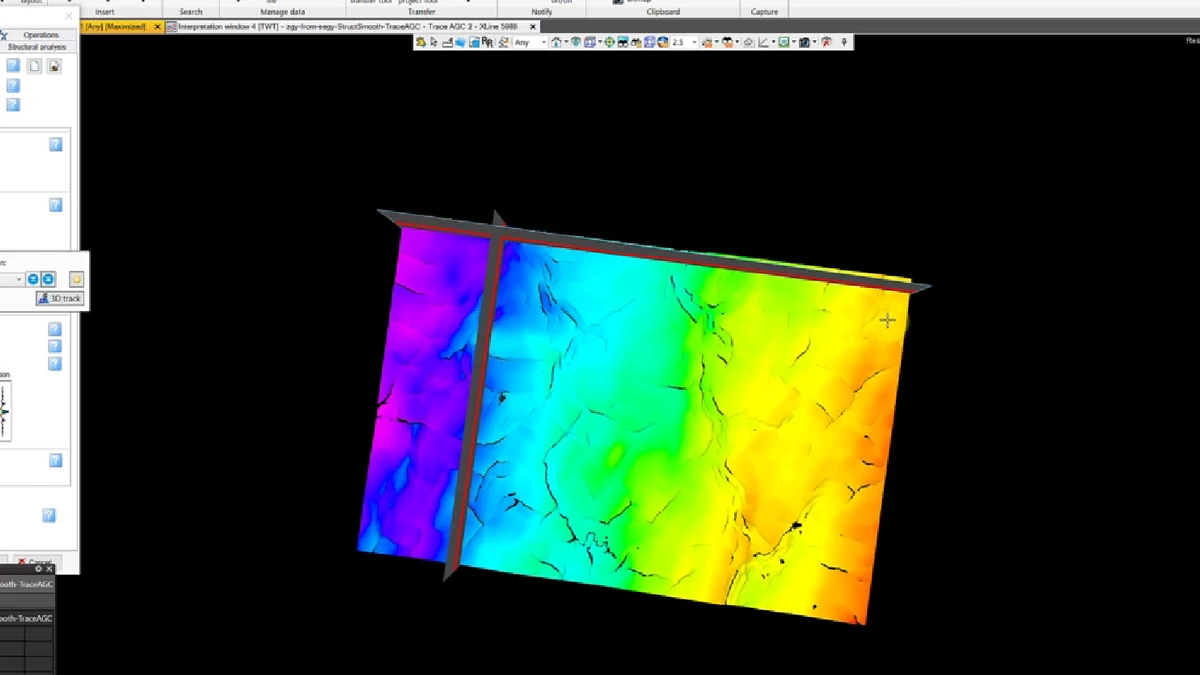
Stage 35 of the Petrel sequence: a colour-ramped structural surface is inspected in map view to identify relief, lineaments and fault-controlled discontinuities.
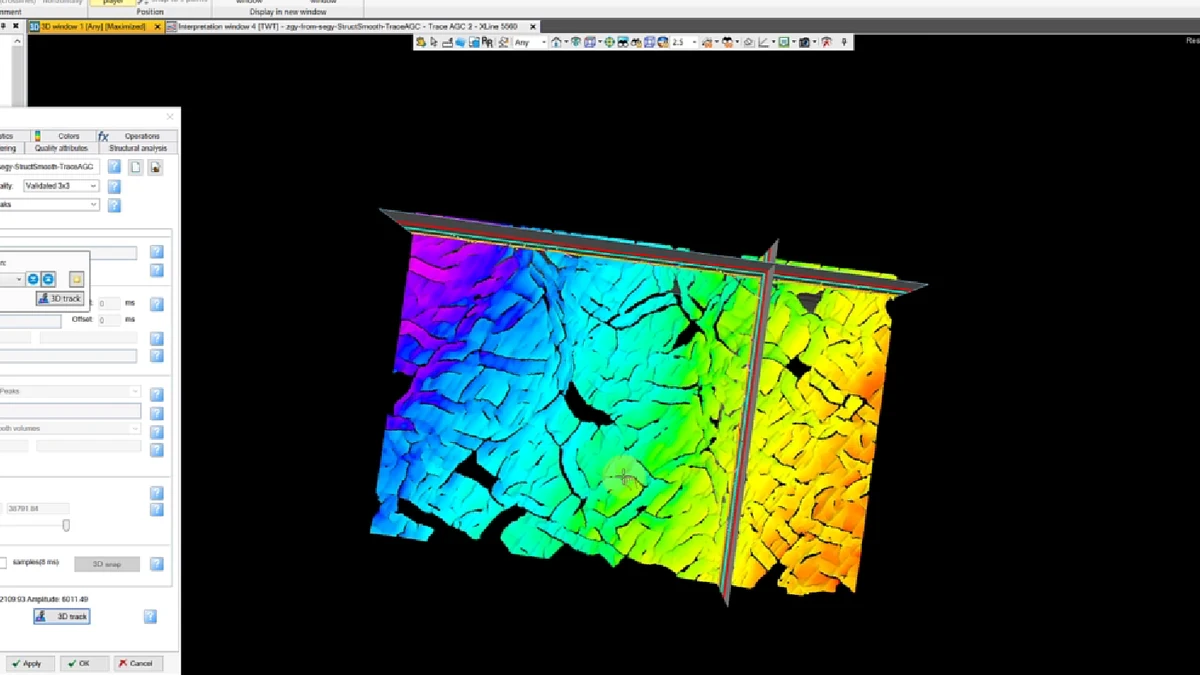
Stage 36 of the Petrel sequence: a colour-ramped structural surface is inspected in map view to identify relief, lineaments and fault-controlled discontinuities.
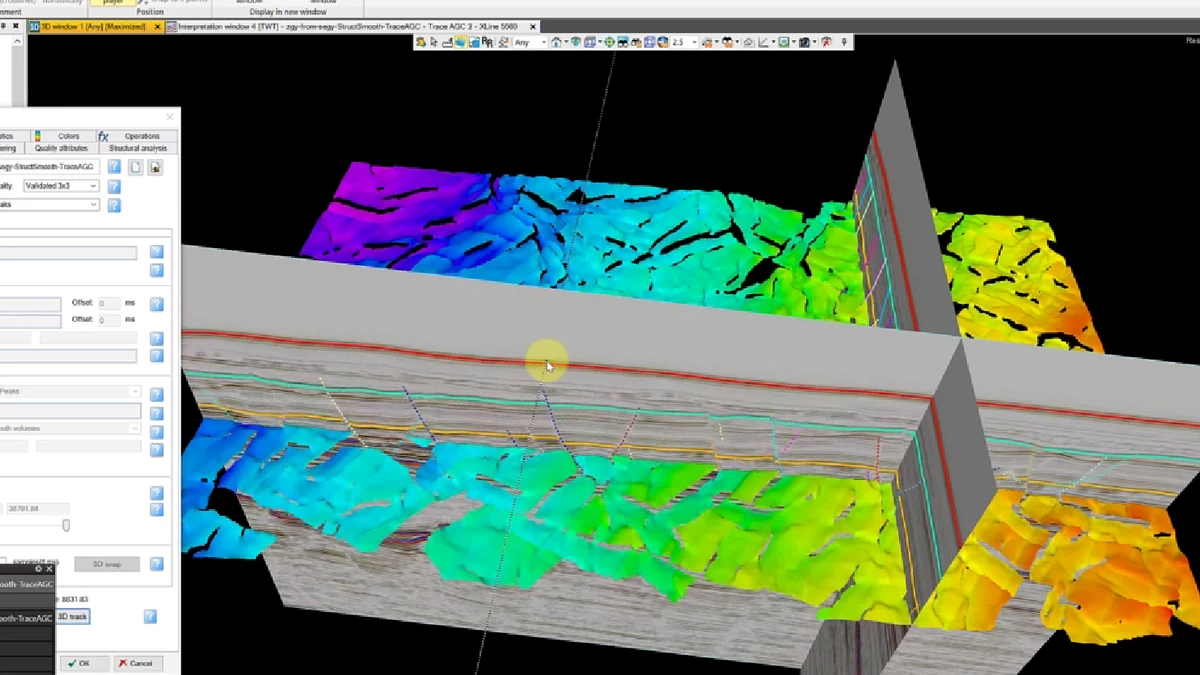
Stage 37 of the Petrel sequence: the mapped surface is intersected by vertical seismic panels, tying surface morphology back to the interpreted reflectors and faults.
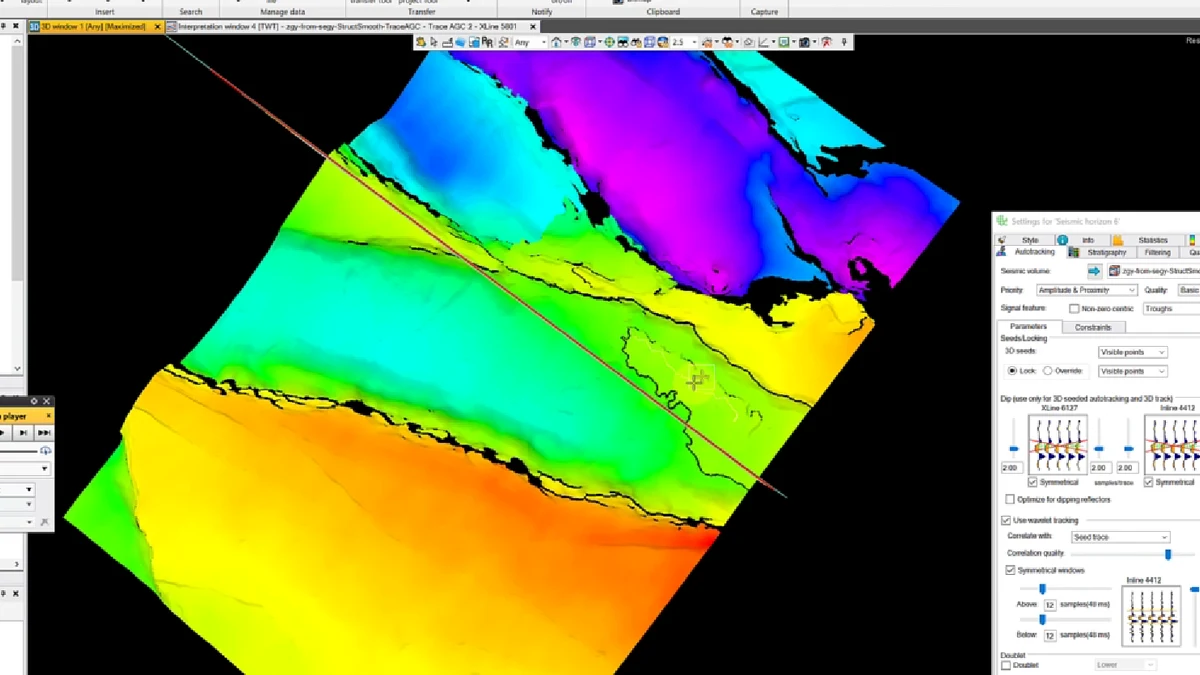
Stage 38 of the Petrel sequence: a colour-ramped structural surface is inspected in map view to identify relief, lineaments and fault-controlled discontinuities.
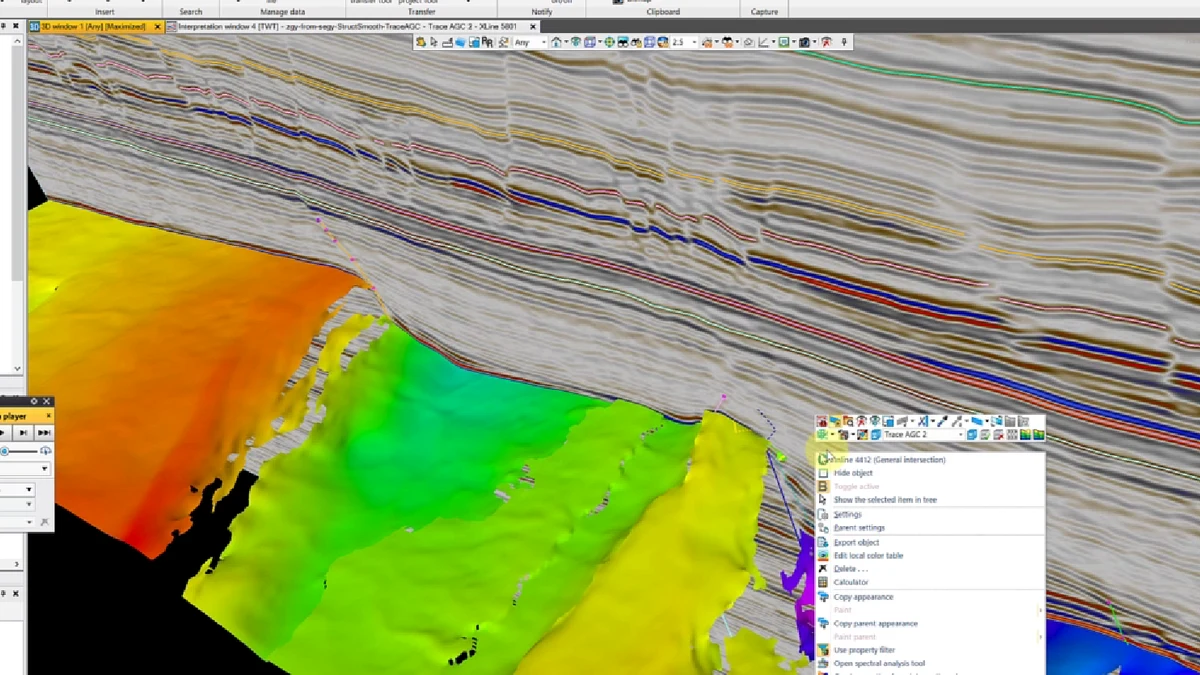
Stage 39 of the Petrel sequence: the mapped surface is intersected by vertical seismic panels, tying surface morphology back to the interpreted reflectors and faults.
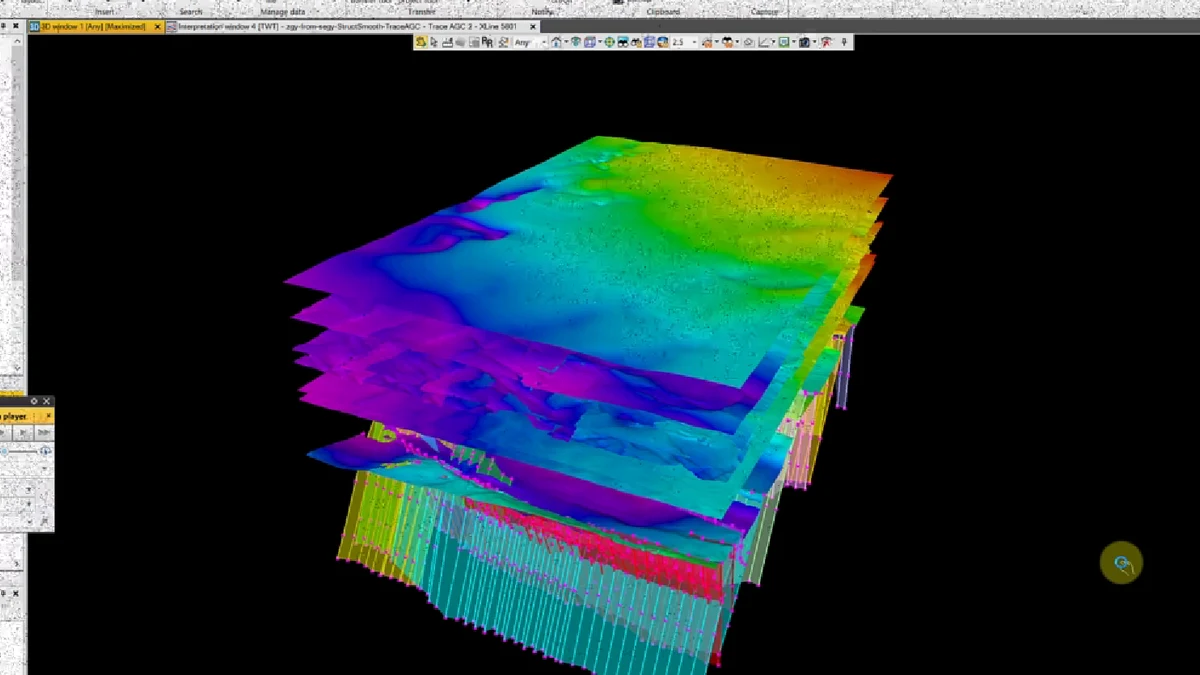
Stage 40 of the Petrel sequence: seismic panels, interpreted horizons and fault surfaces are displayed together in the final three-dimensional structural scene.
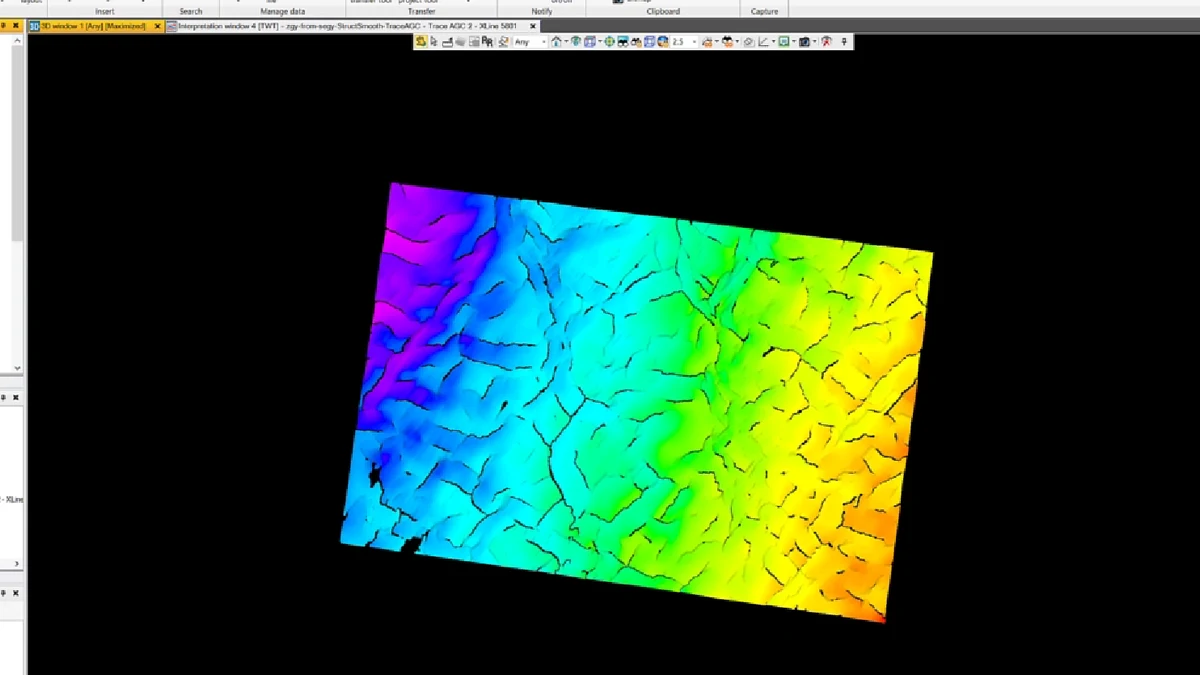
Stage 41 of the Petrel sequence: a colour-ramped structural surface is inspected in map view to identify relief, lineaments and fault-controlled discontinuities.
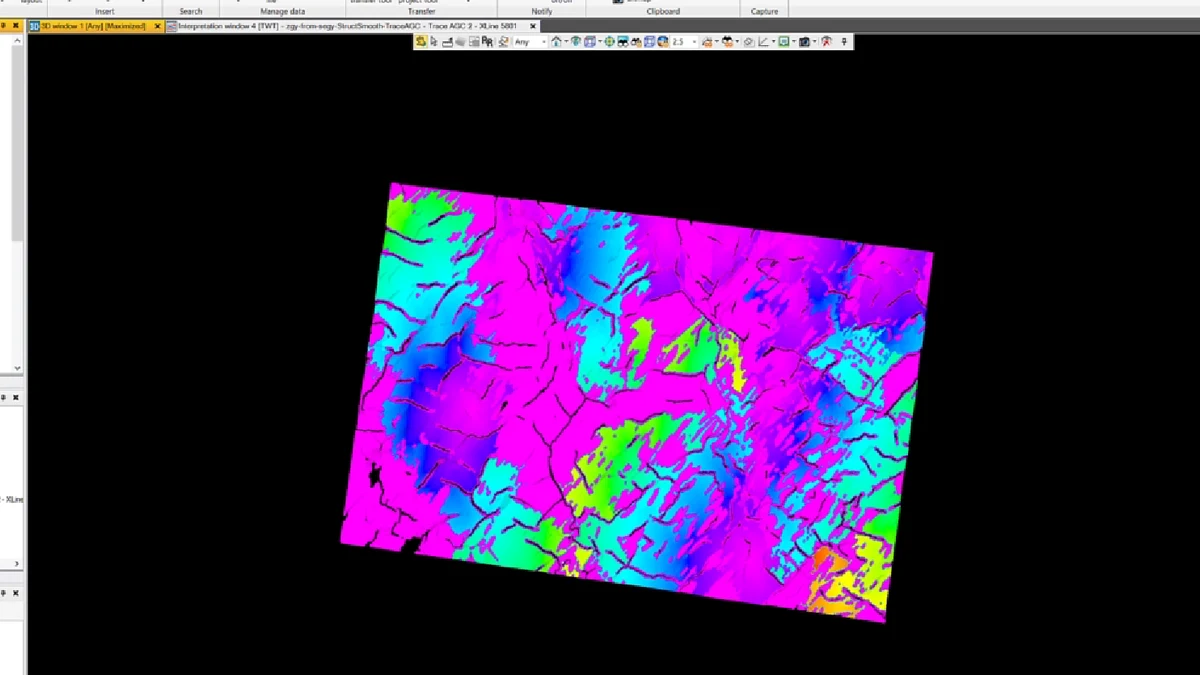
Stage 42 of the Petrel sequence: a derived surface attribute is displayed continuously and categorically to emphasise lineaments, local relief changes and structural texture.
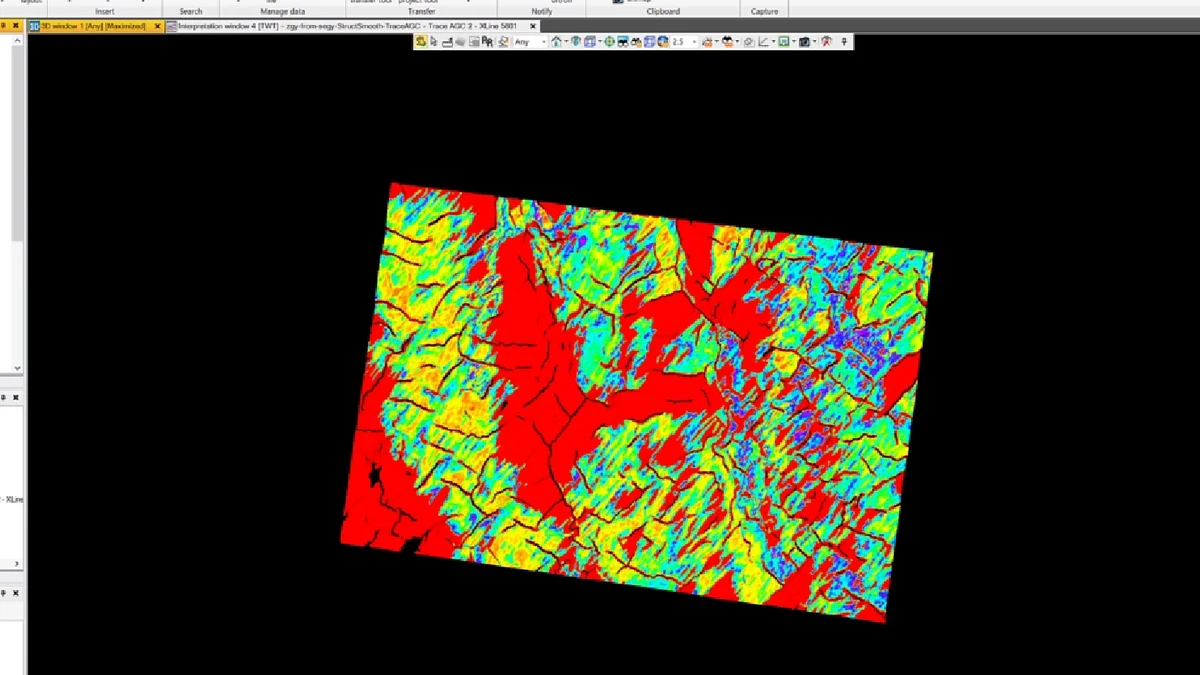
Stage 43 of the Petrel sequence: a derived surface attribute is displayed continuously and categorically to emphasise lineaments, local relief changes and structural texture.
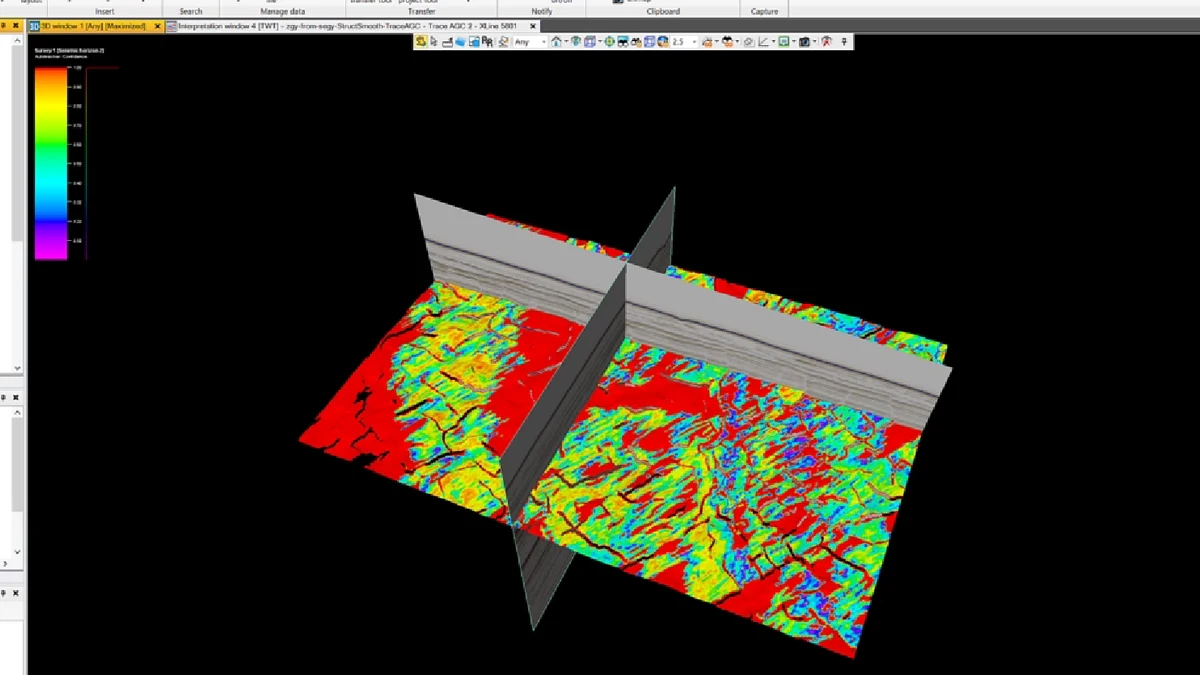
Stage 44 of the Petrel sequence: the mapped surface is intersected by vertical seismic panels, tying surface morphology back to the interpreted reflectors and faults.
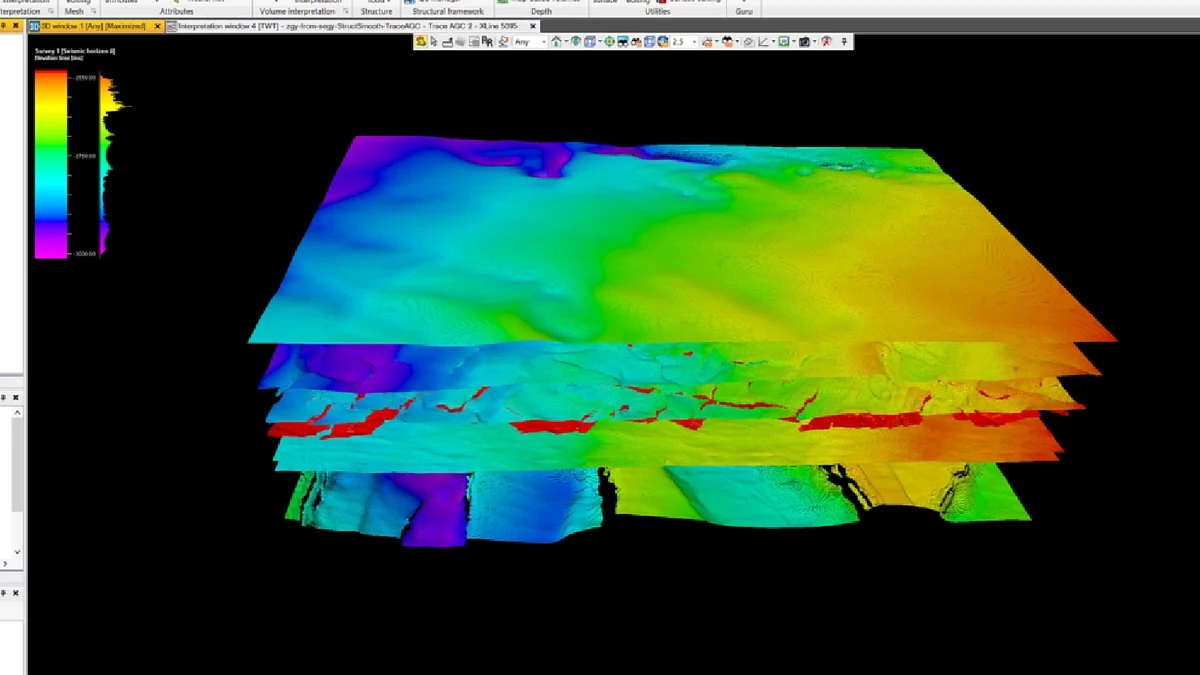
Stage 45 of the Petrel sequence: several interpreted horizon surfaces are stacked and contoured to review stratigraphic order, vertical separation and local surface shape.
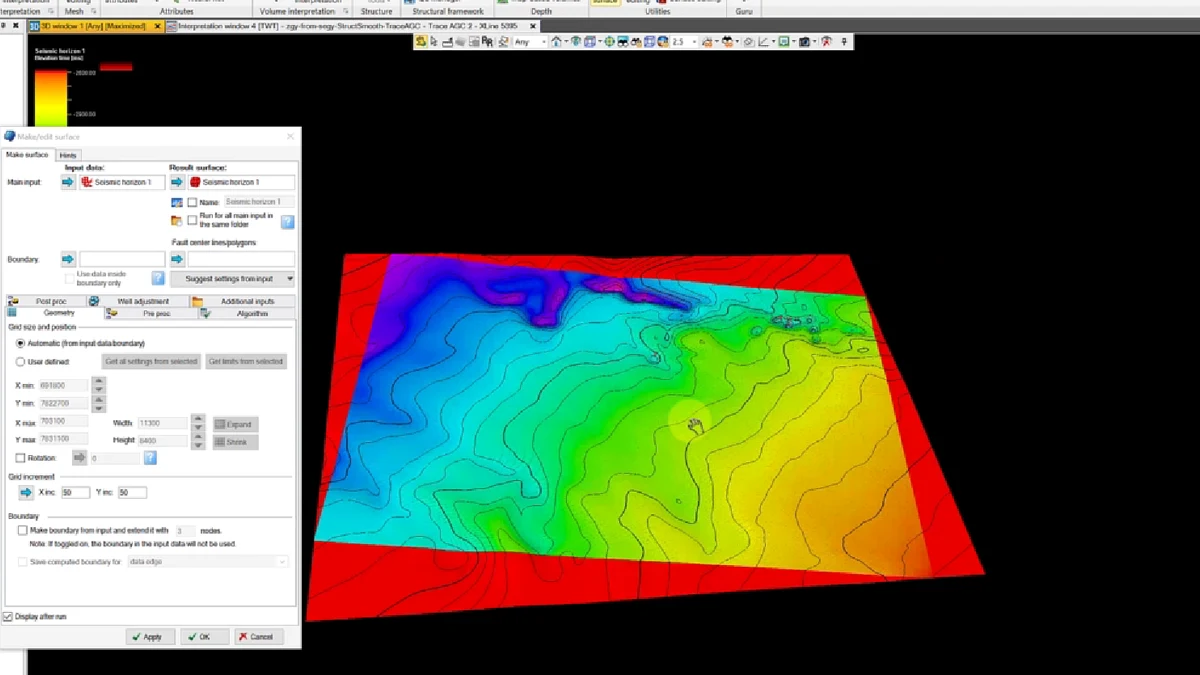
Stage 46 of the Petrel sequence: several interpreted horizon surfaces are stacked and contoured to review stratigraphic order, vertical separation and local surface shape.
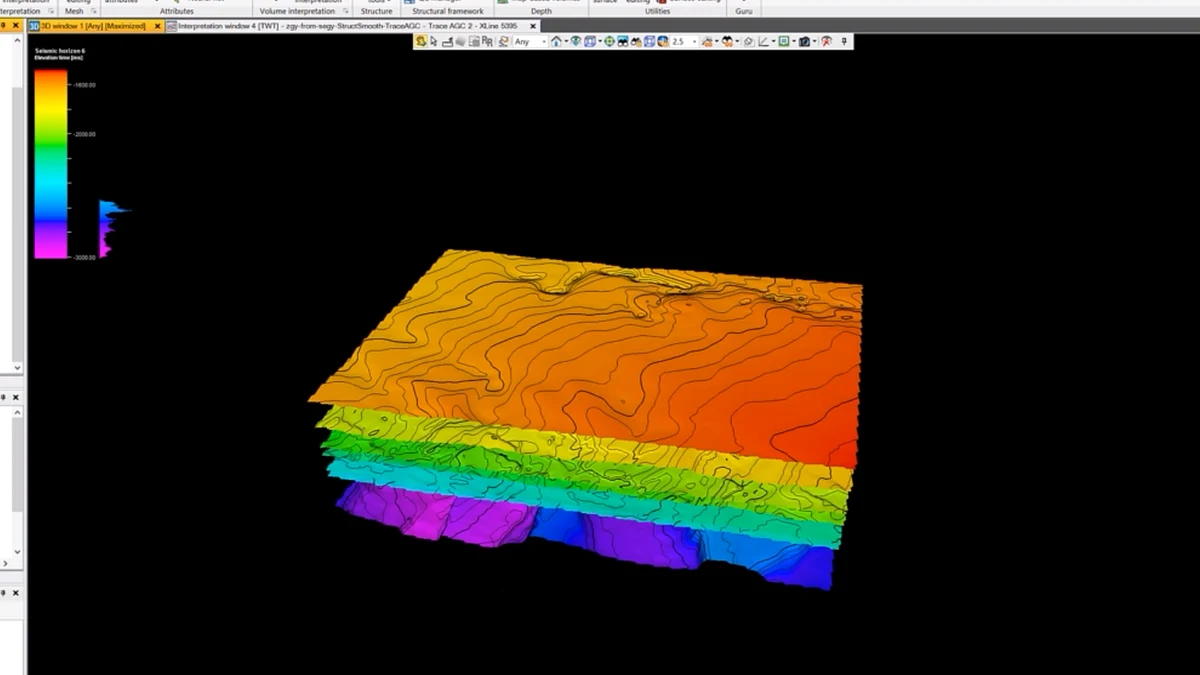
Stage 47 of the Petrel sequence: several interpreted horizon surfaces are stacked and contoured to review stratigraphic order, vertical separation and local surface shape.
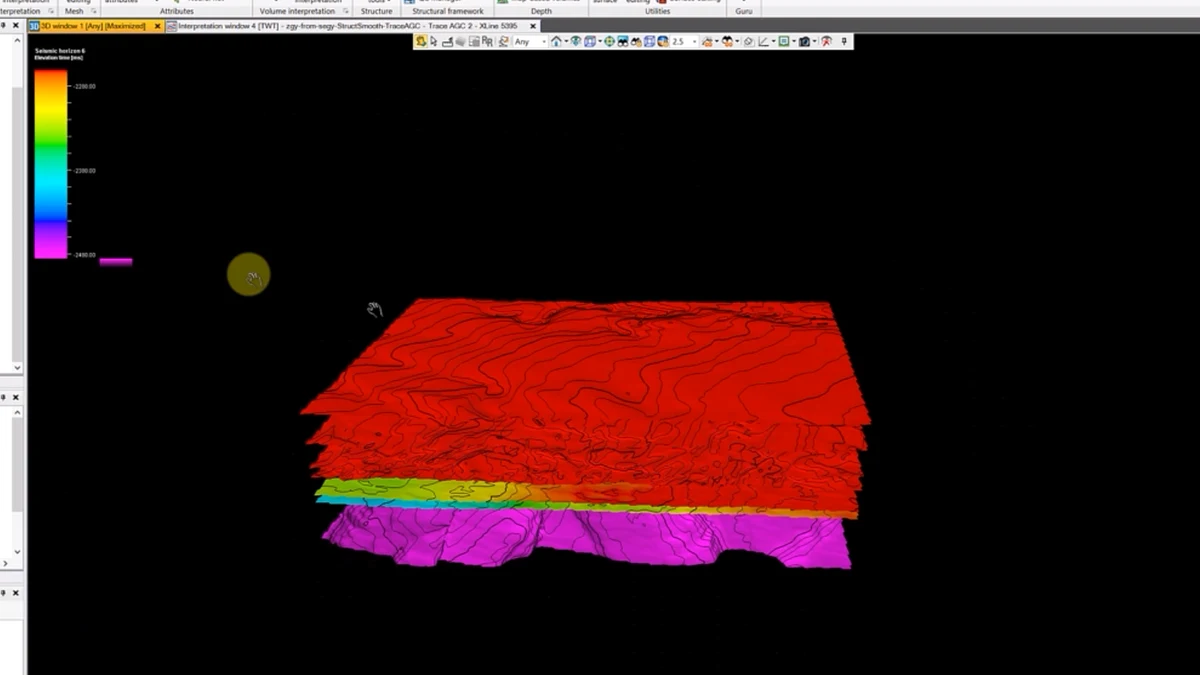
Stage 48 of the Petrel sequence: several interpreted horizon surfaces are stacked and contoured to review stratigraphic order, vertical separation and local surface shape.
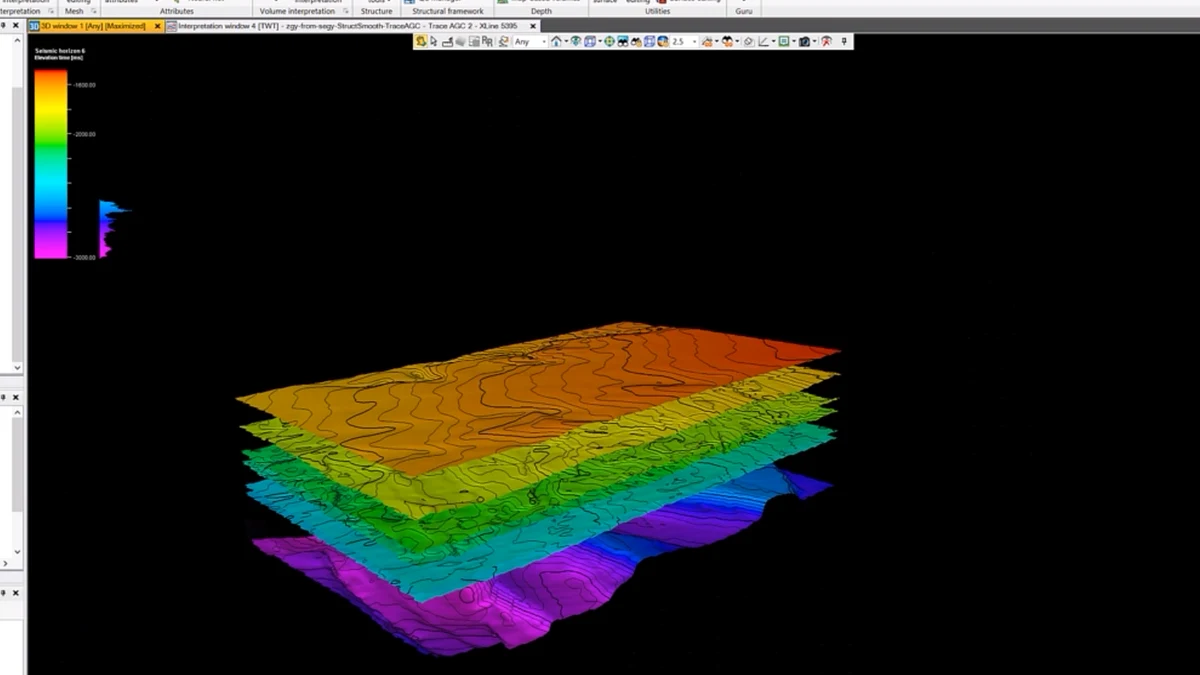
Stage 49 of the Petrel sequence: several interpreted horizon surfaces are stacked and contoured to review stratigraphic order, vertical separation and local surface shape.
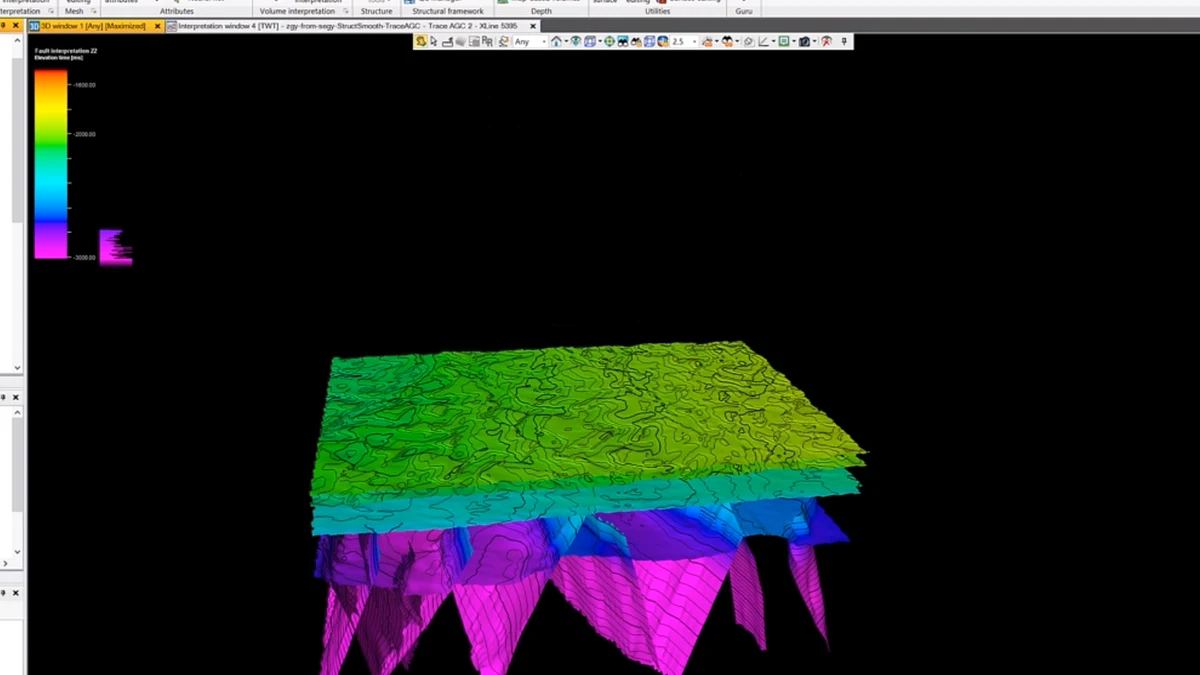
Stage 50 of the Petrel sequence: the fault framework is combined with overlying horizons or a grid-based structural surface, forming the principal geometry of the model.
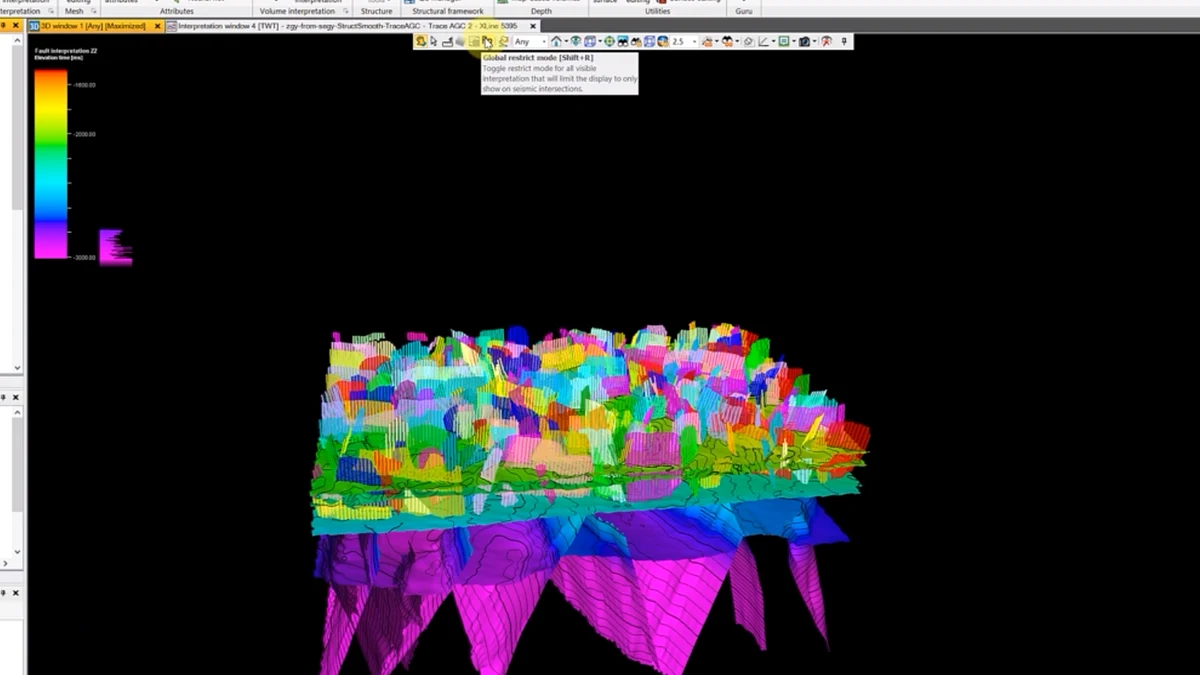
Stage 51 of the Petrel sequence: the fault framework is combined with overlying horizons or a grid-based structural surface, forming the principal geometry of the model.
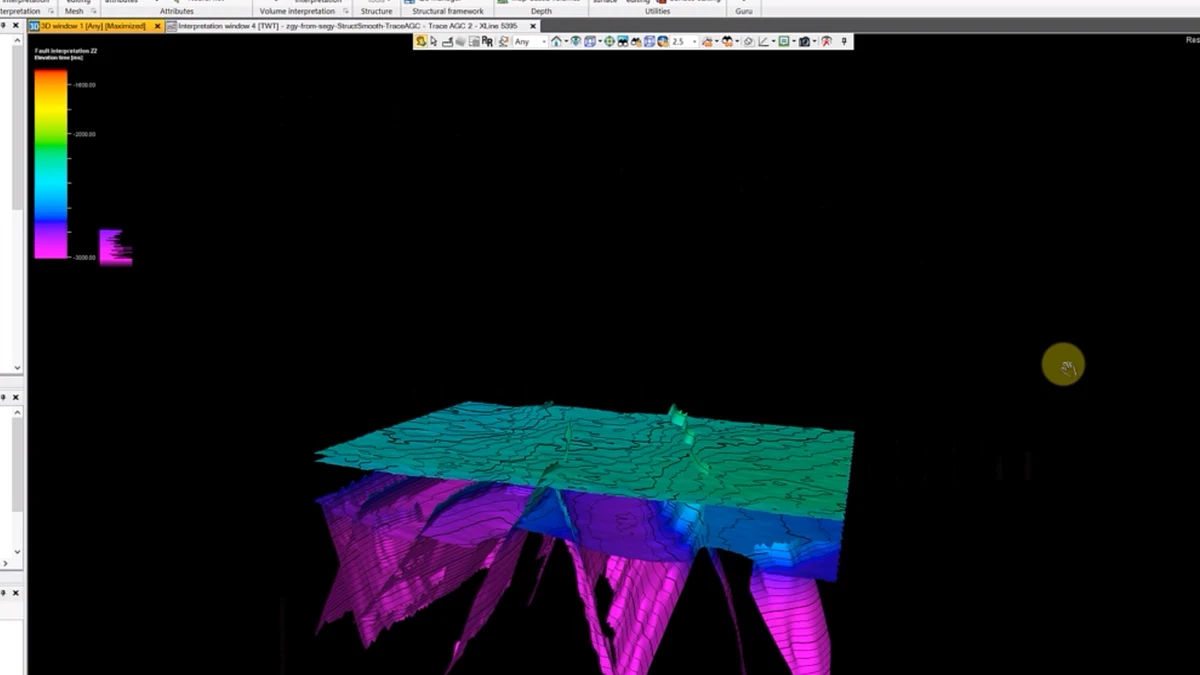
Stage 52 of the Petrel sequence: the fault framework is combined with overlying horizons or a grid-based structural surface, forming the principal geometry of the model.
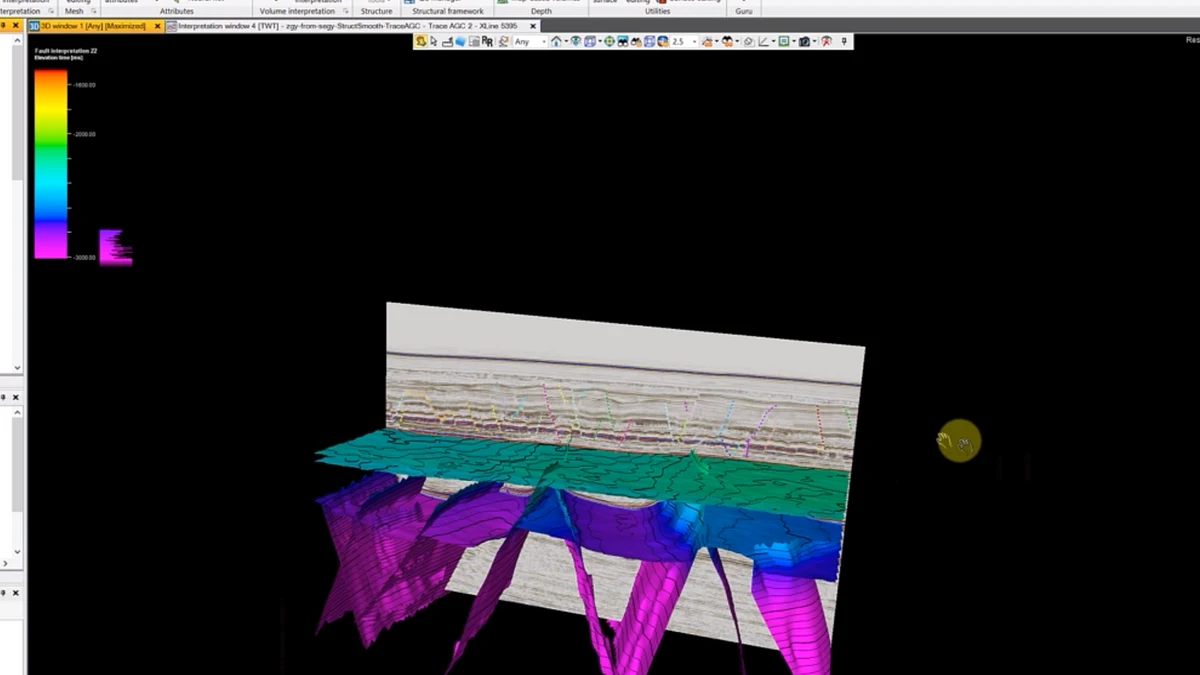
Stage 53 of the Petrel sequence: seismic panels, interpreted horizons and fault surfaces are displayed together in the final three-dimensional structural scene.
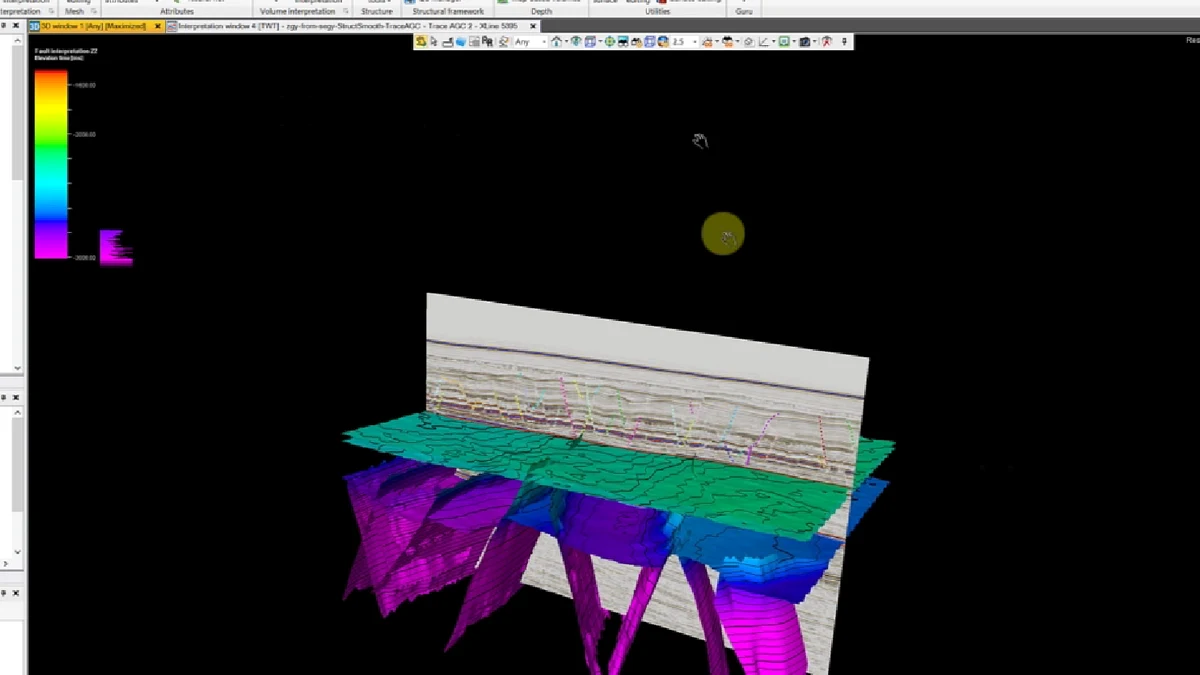
Stage 54 of the Petrel sequence: seismic panels, interpreted horizons and fault surfaces are displayed together in the final three-dimensional structural scene.
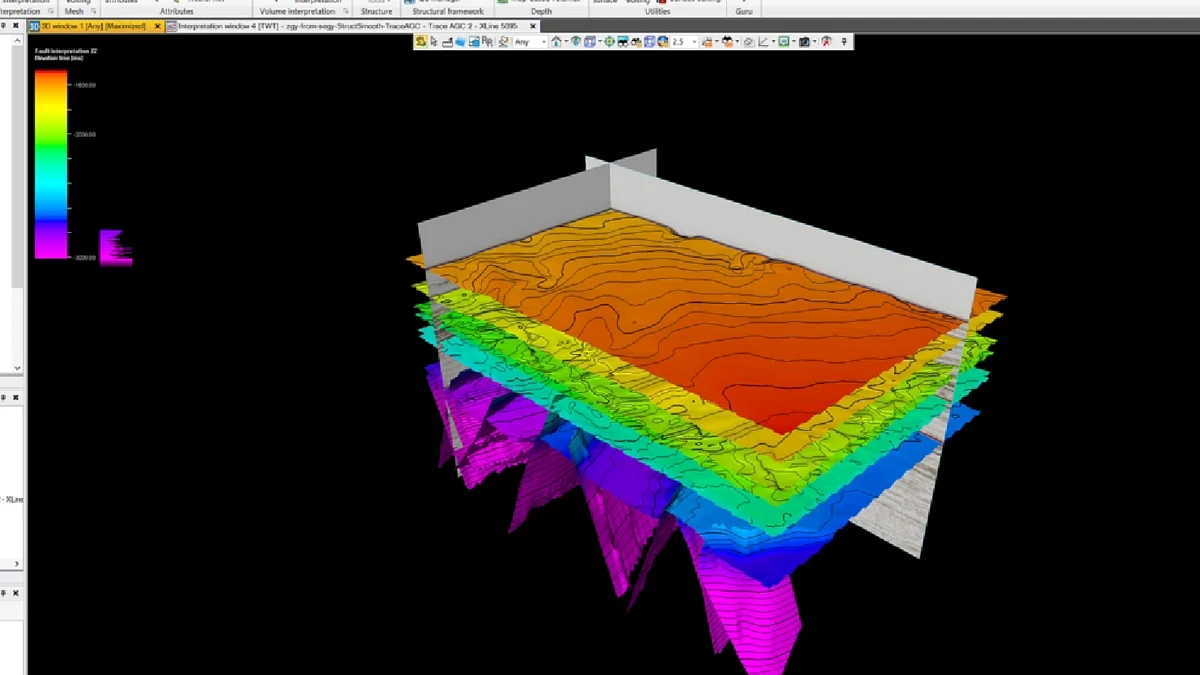
Stage 55 of the Petrel sequence: seismic panels, interpreted horizons and fault surfaces are displayed together in the final three-dimensional structural scene.