internship-4-1
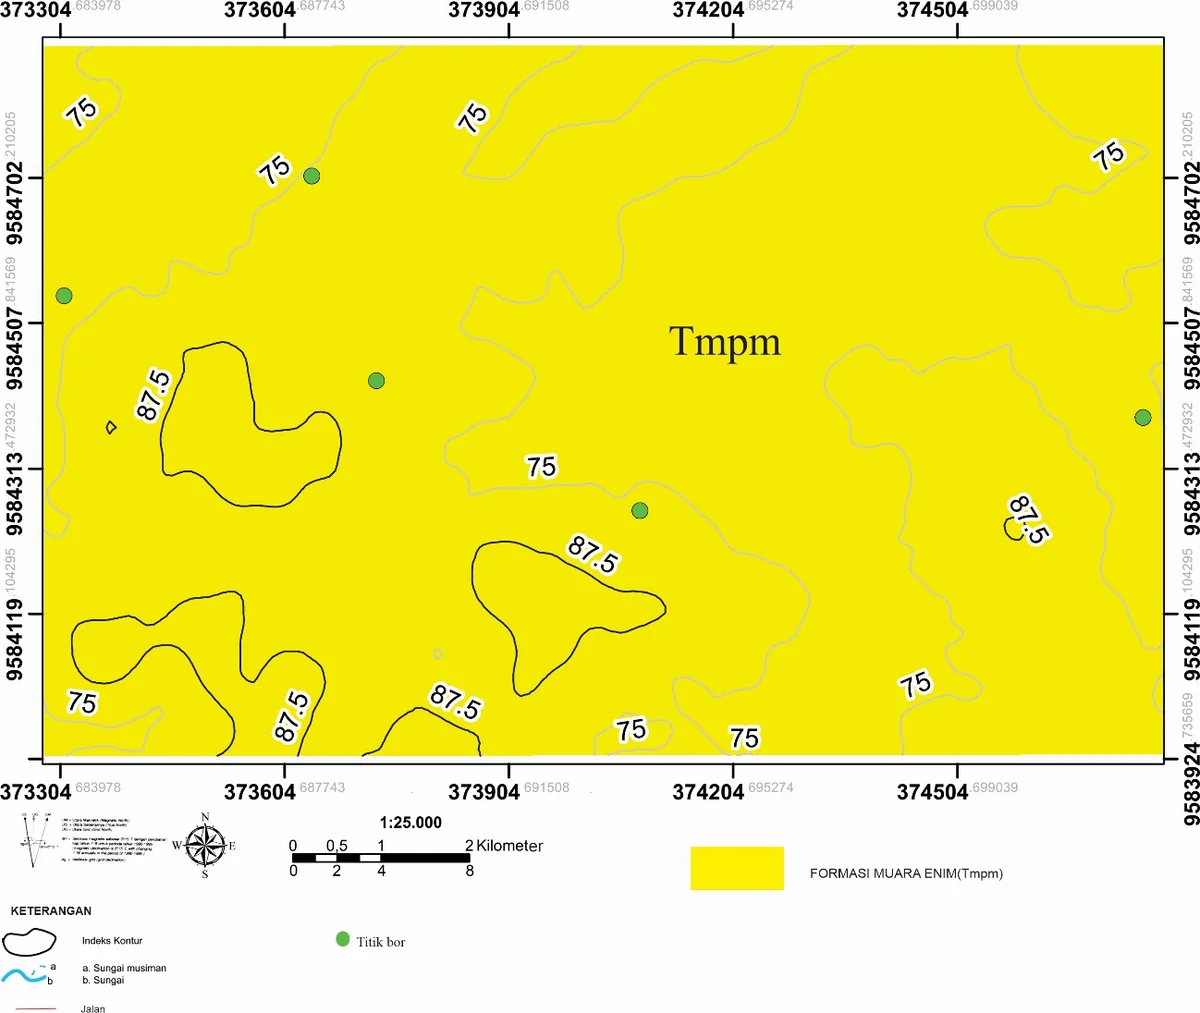
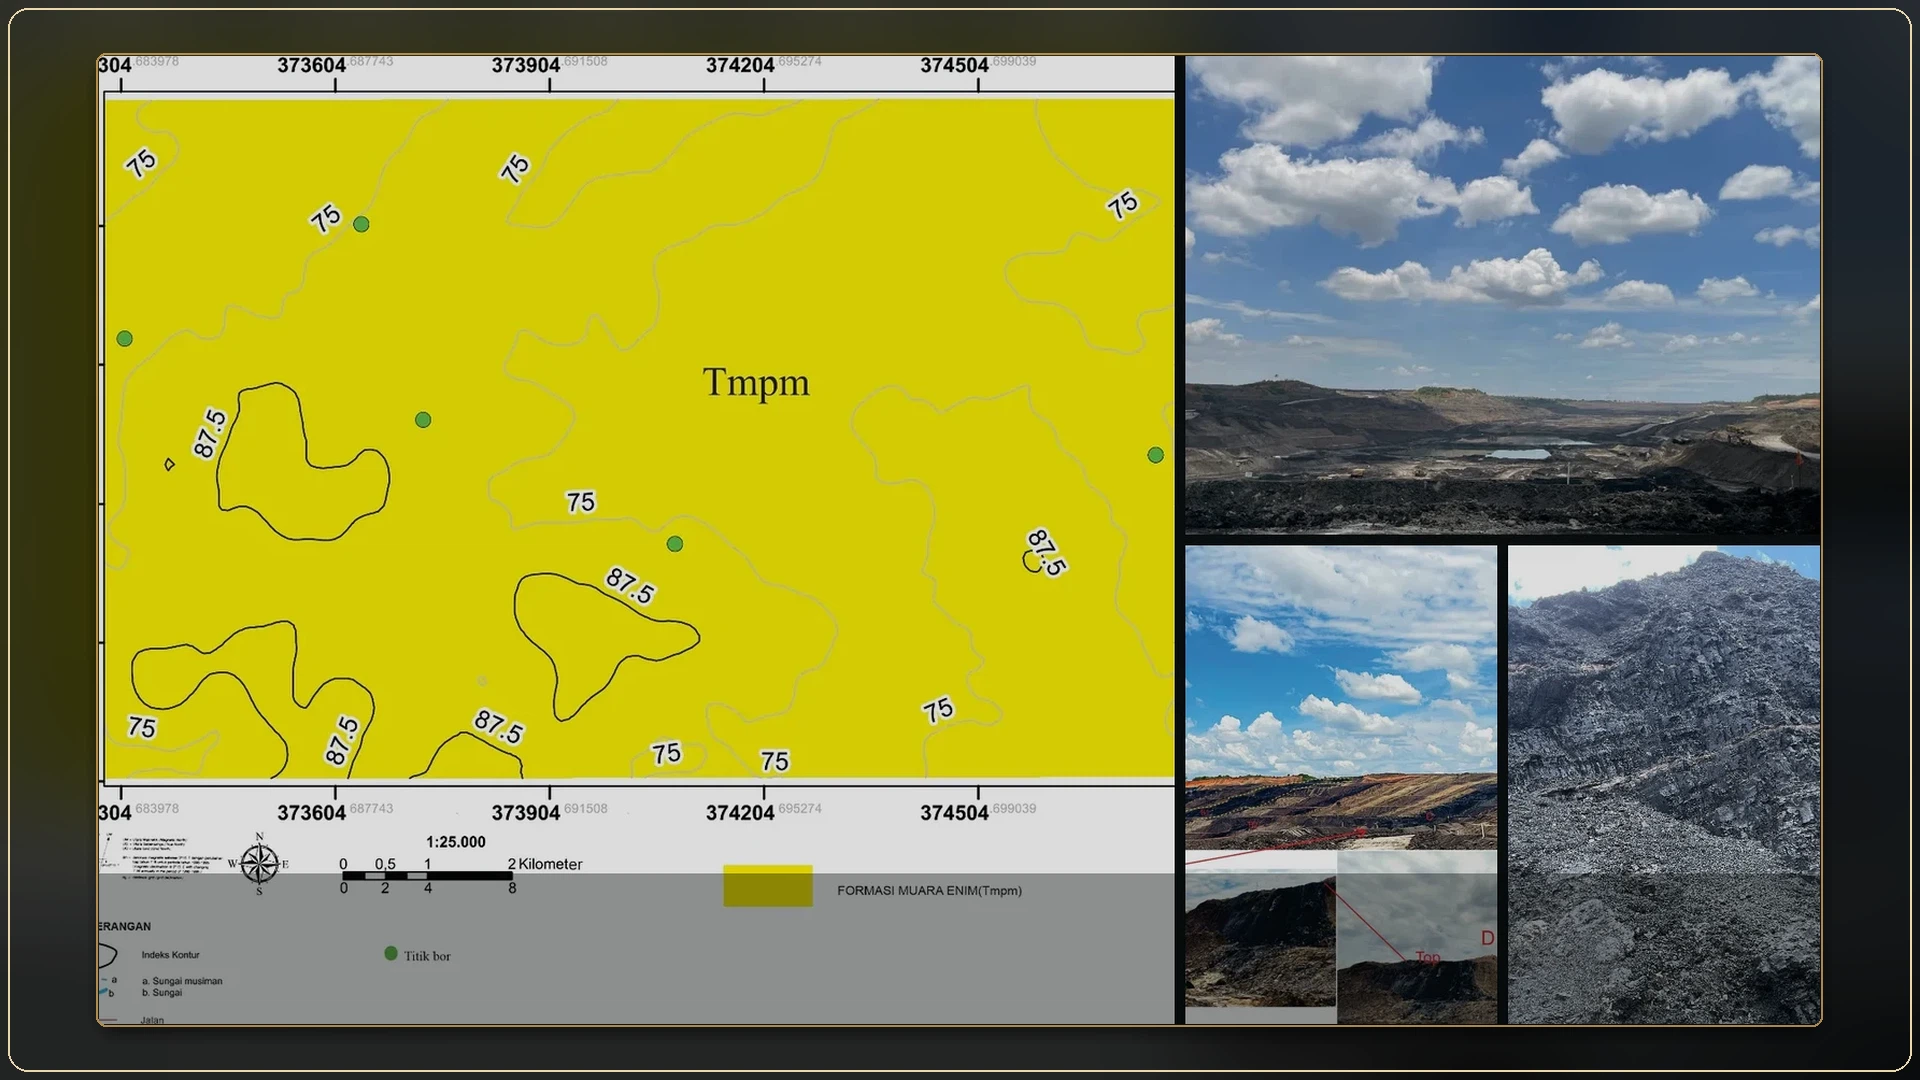
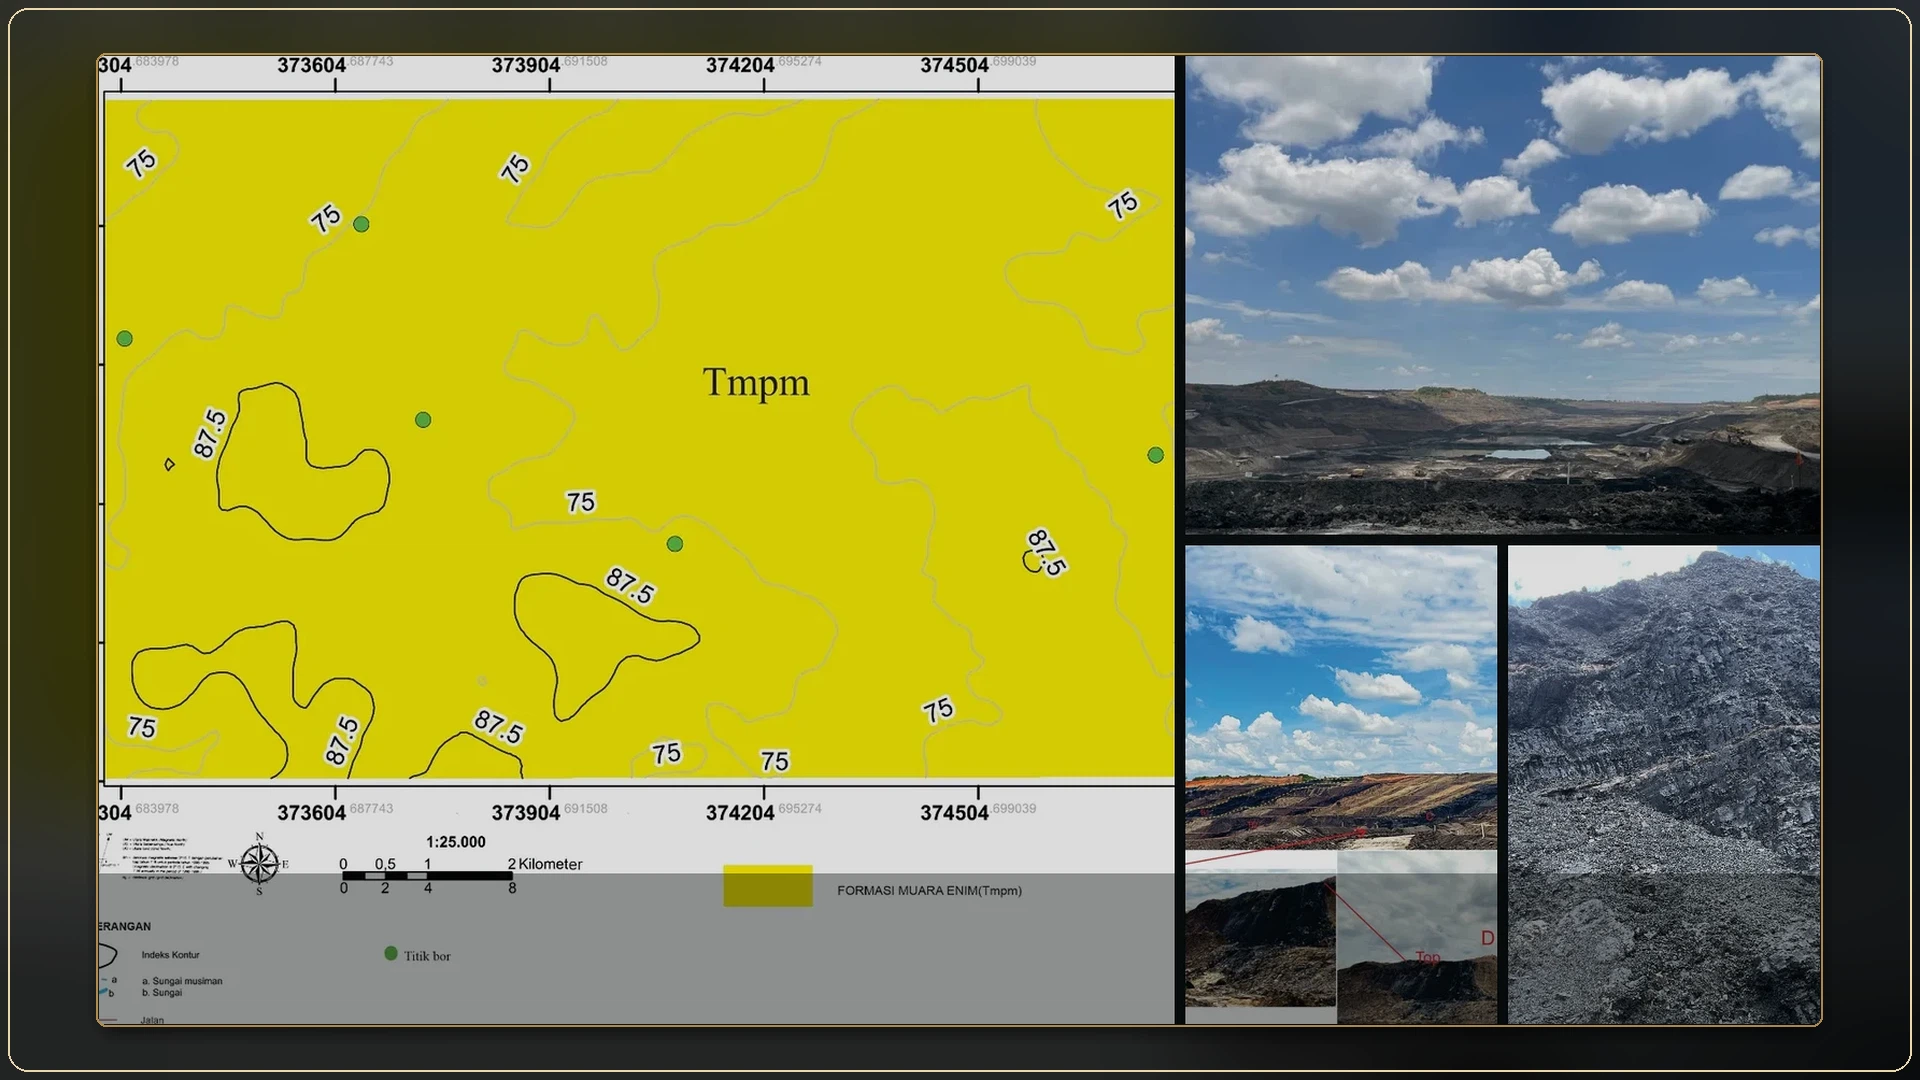
Borehole-location map
Borehole-location map.
Internship Report — PTBA
The internship sequence presents 45 report figures together with five linked MineScape outputs, arranged from geological control and seam interpretation to model review.
ALBUM
45 records
Borehole-location map.
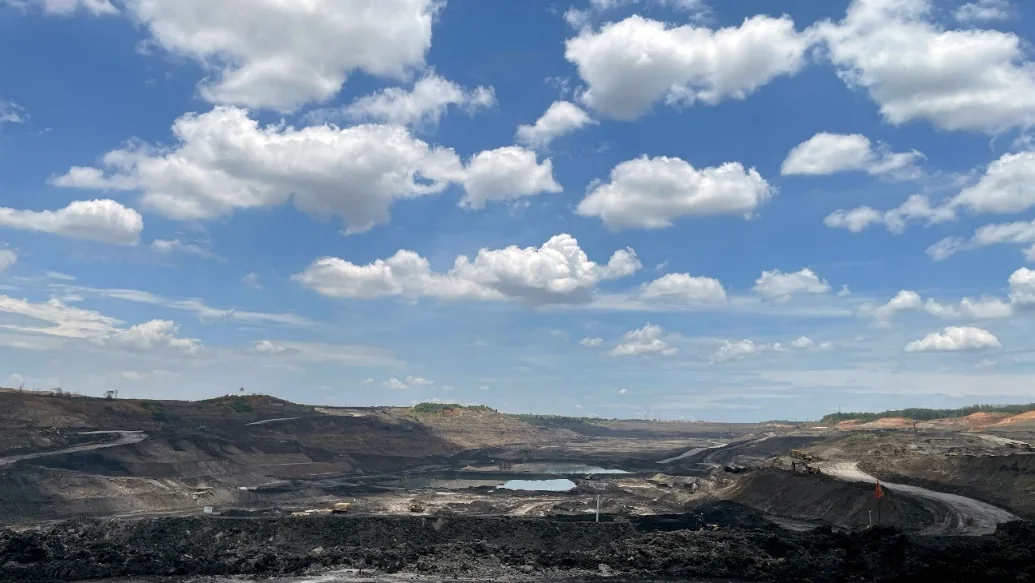
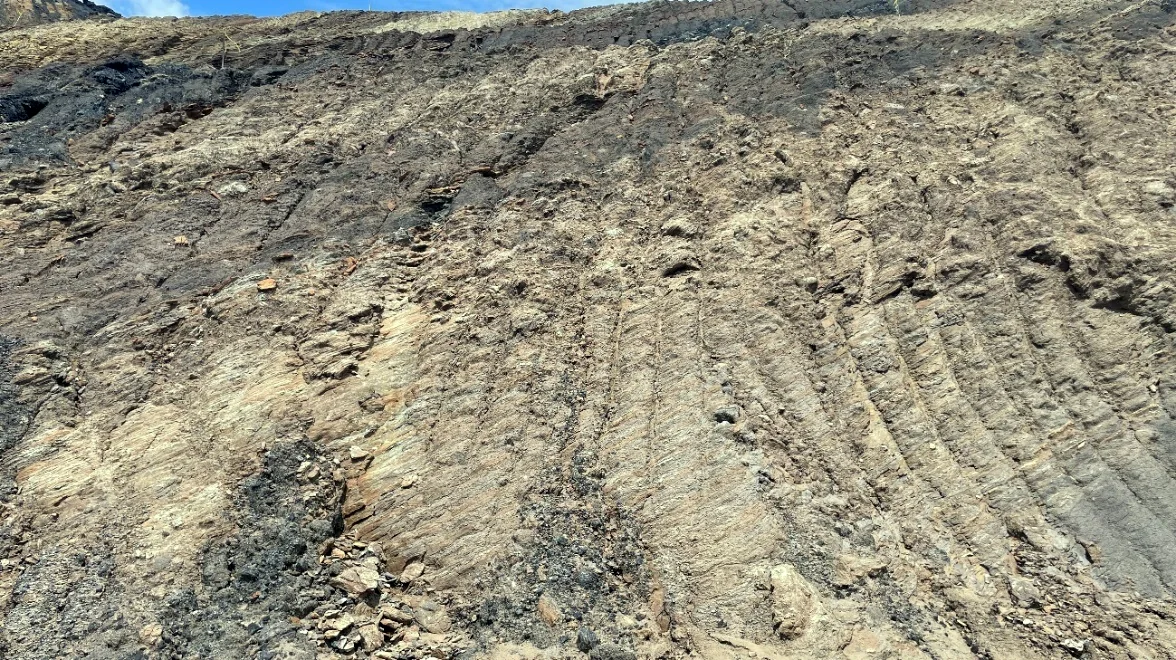
The figure records the terrain setting surrounding the coal-bearing succession.
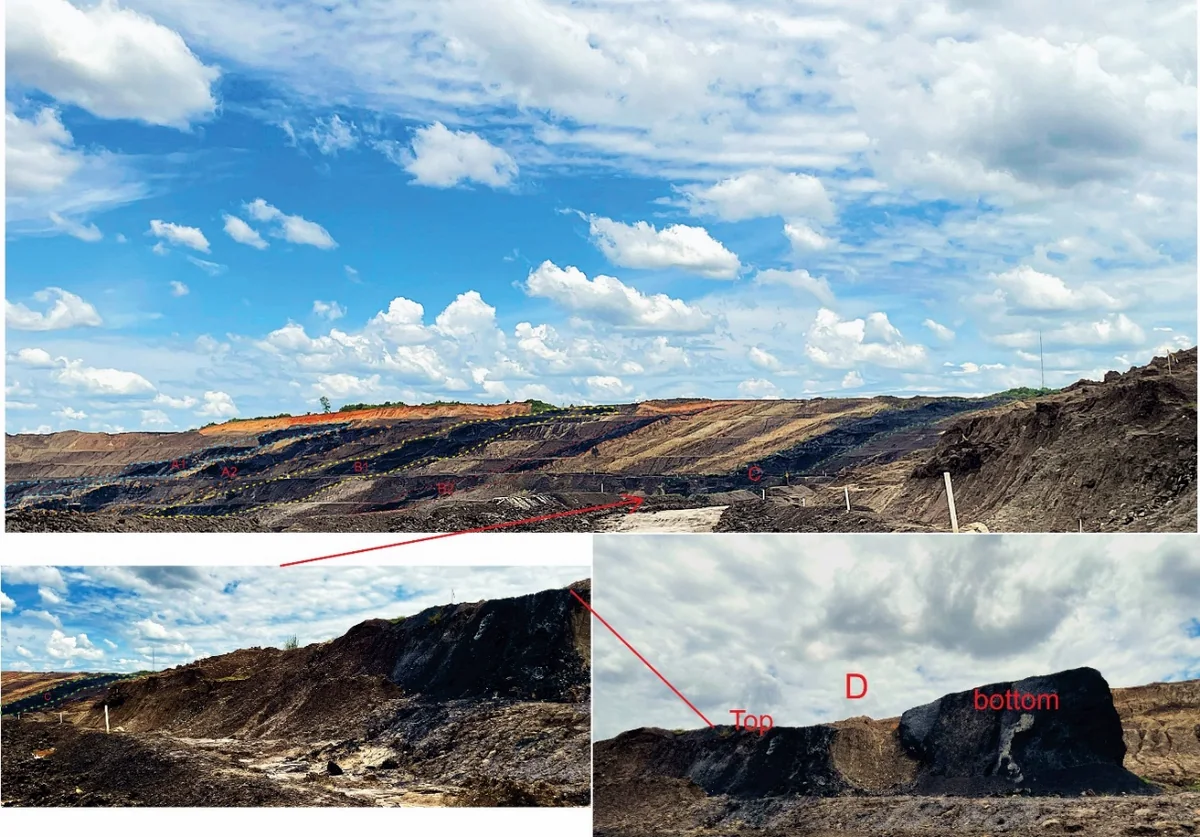
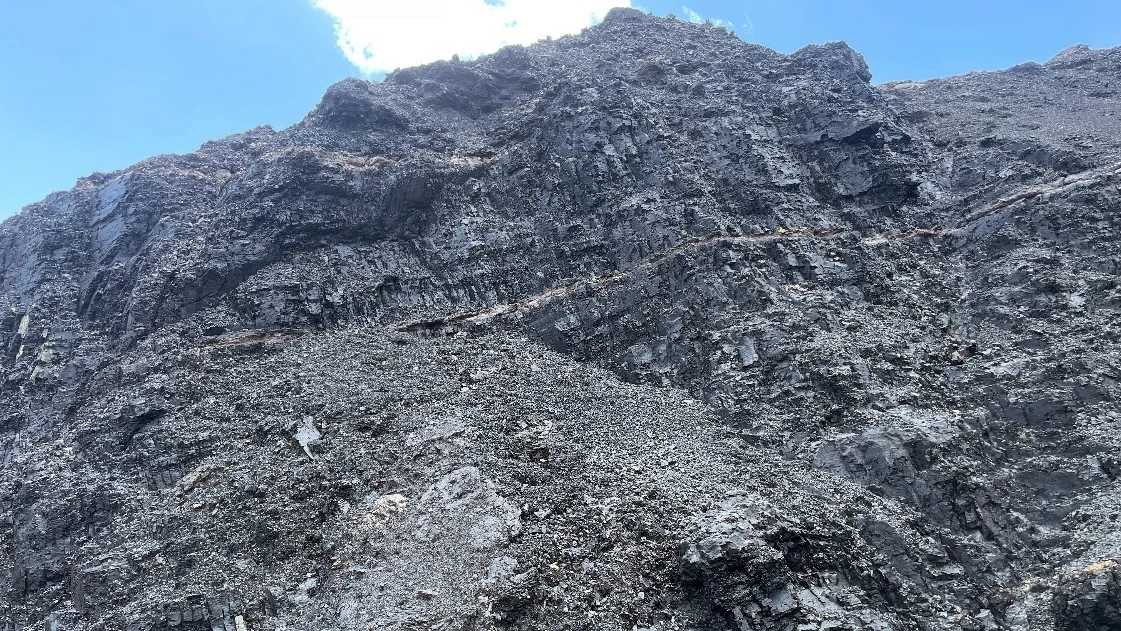
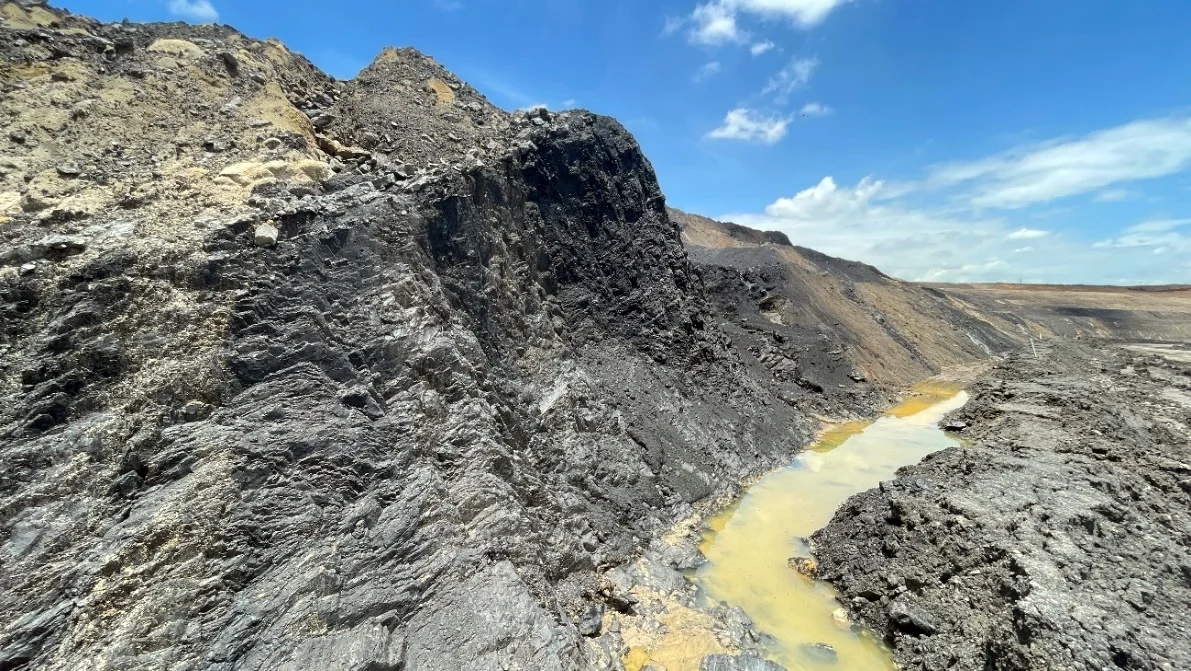
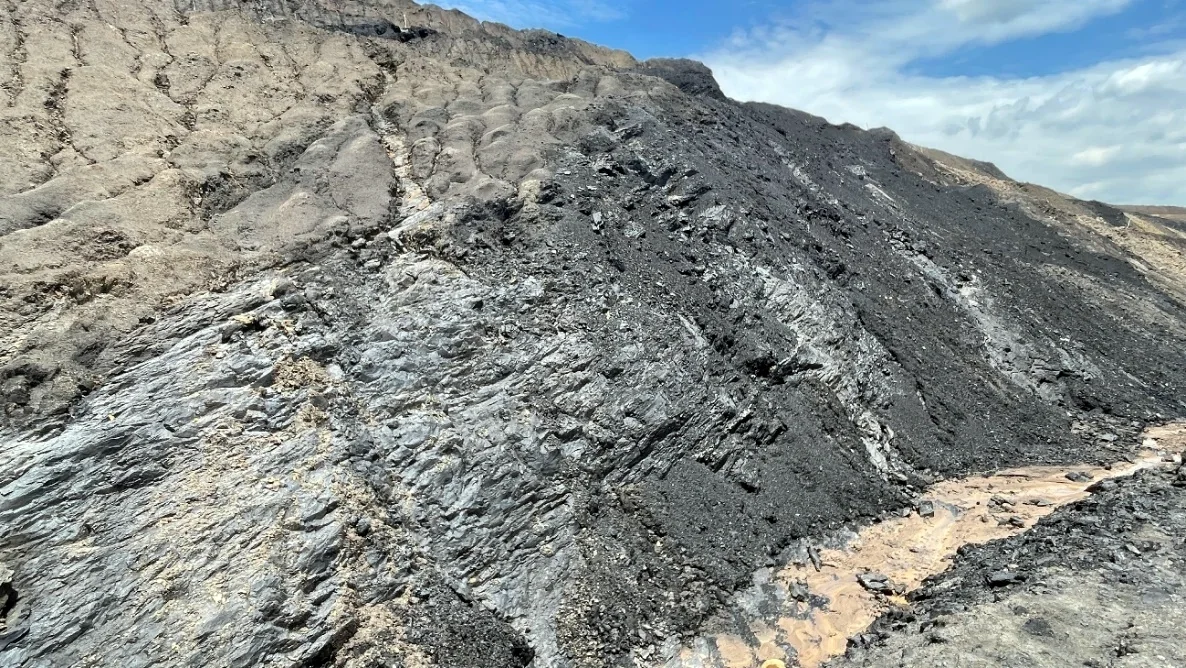
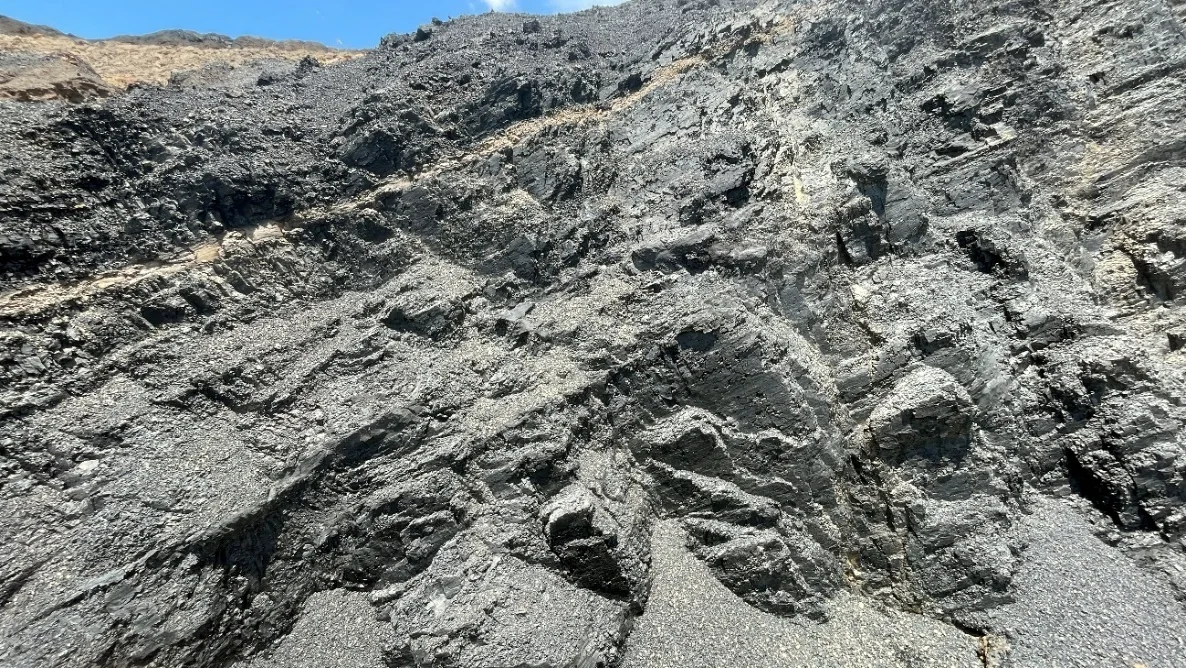
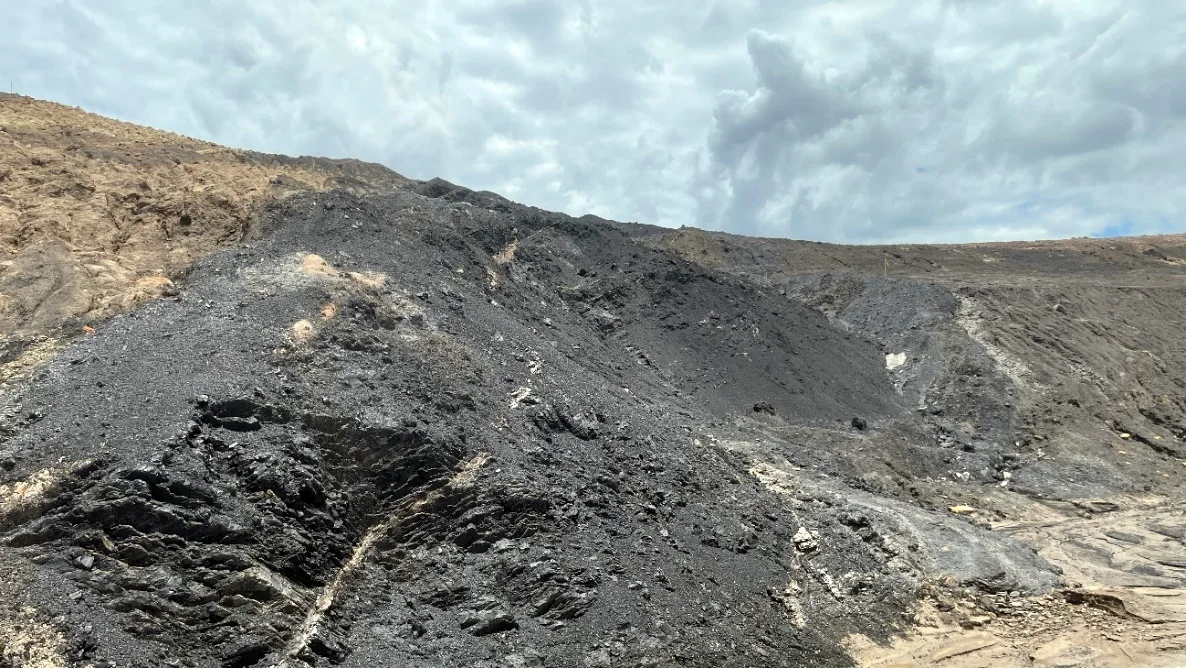
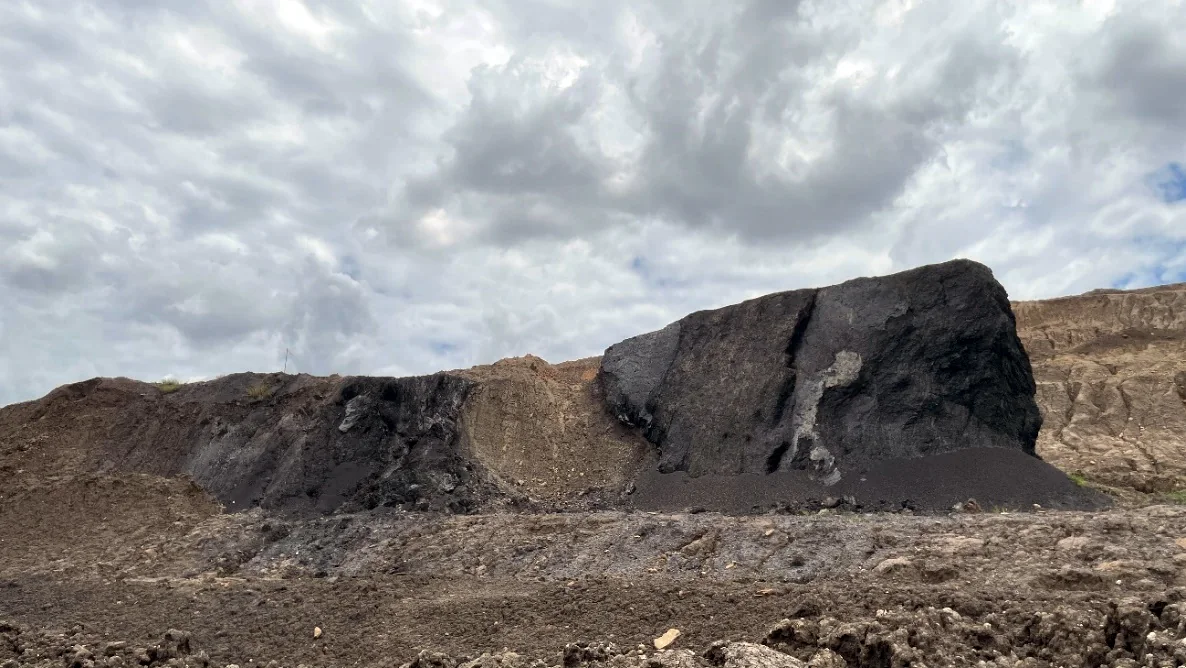
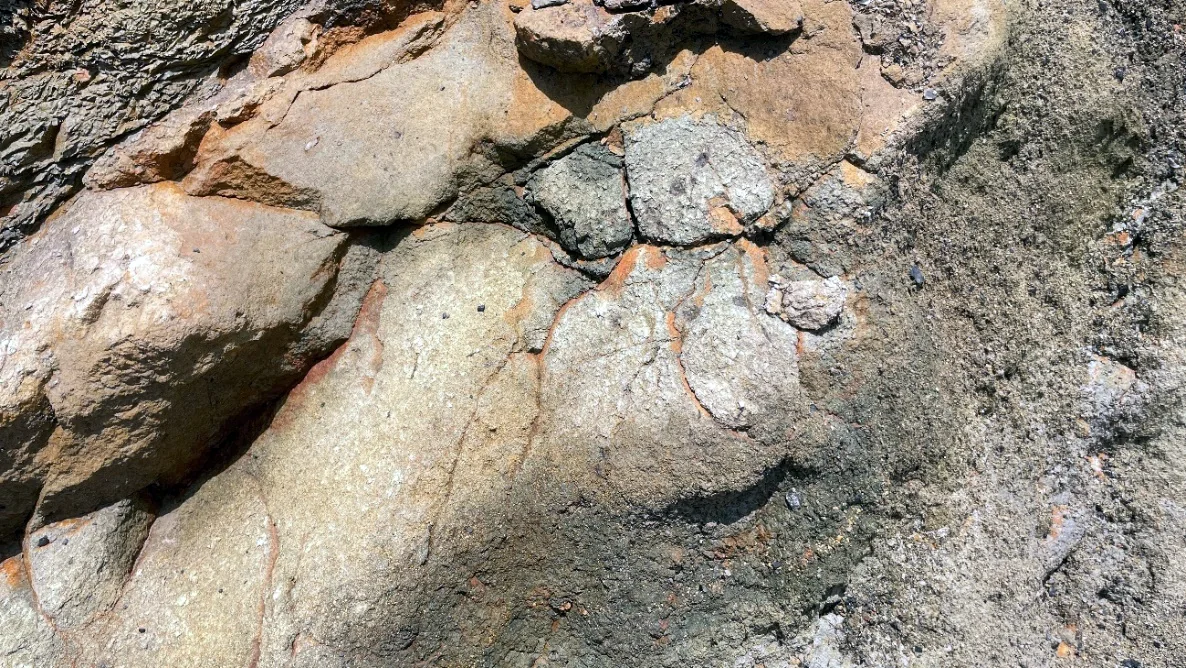
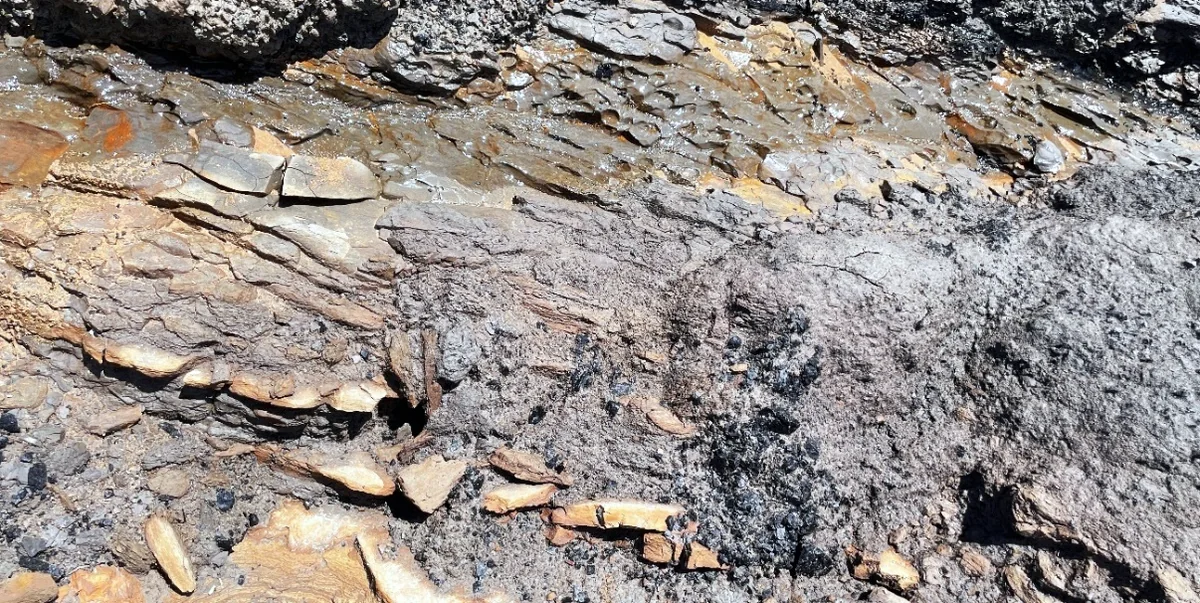
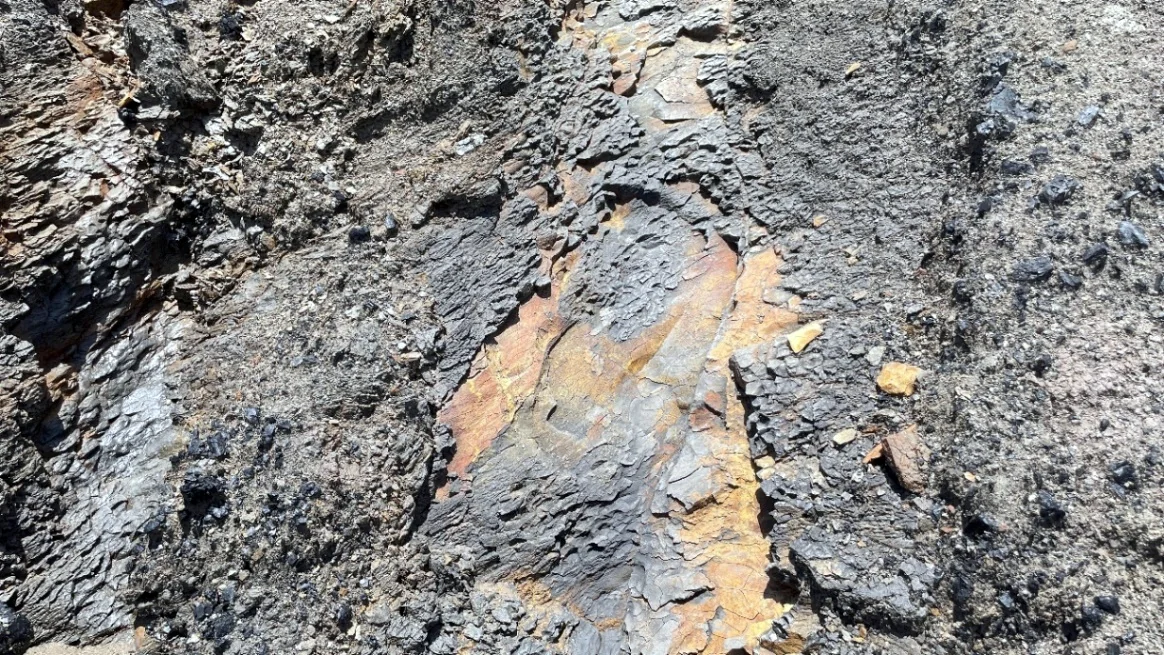
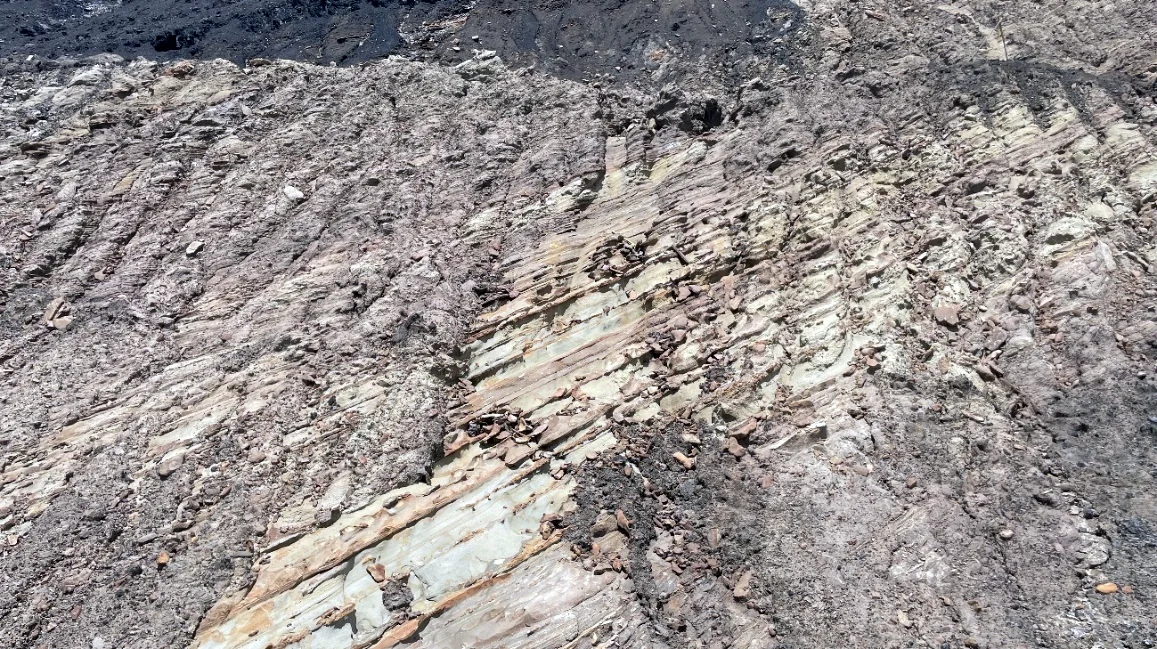
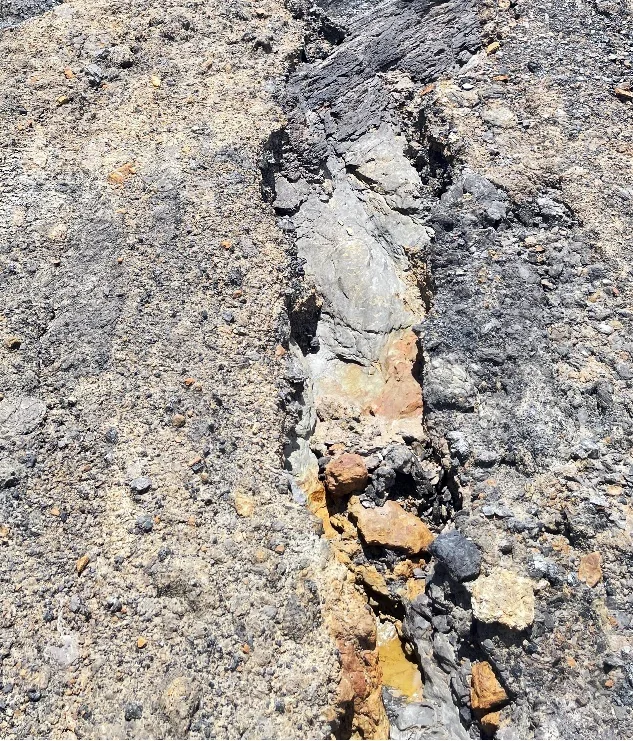
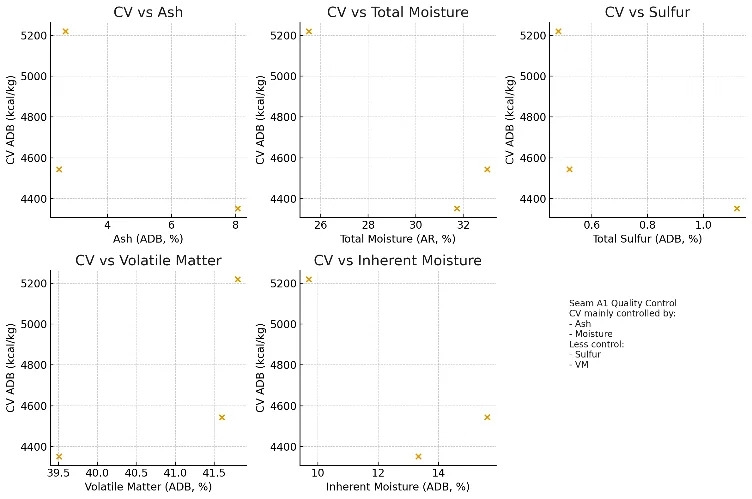
Coal-quality plots compare calorific value with the measured quality parameters for Seam A1.
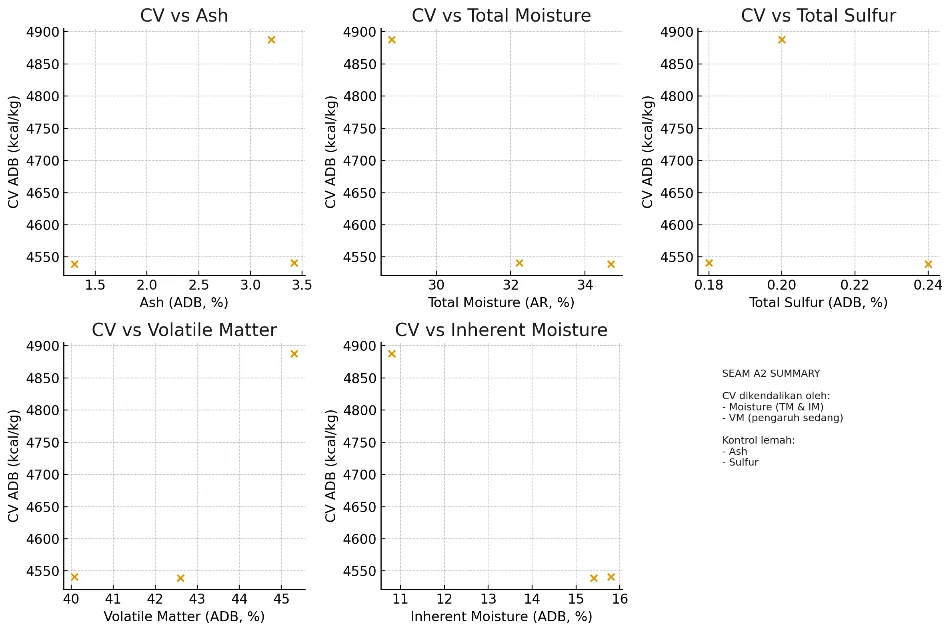
Coal-quality plots compare calorific value with the measured quality parameters for Seam A2.
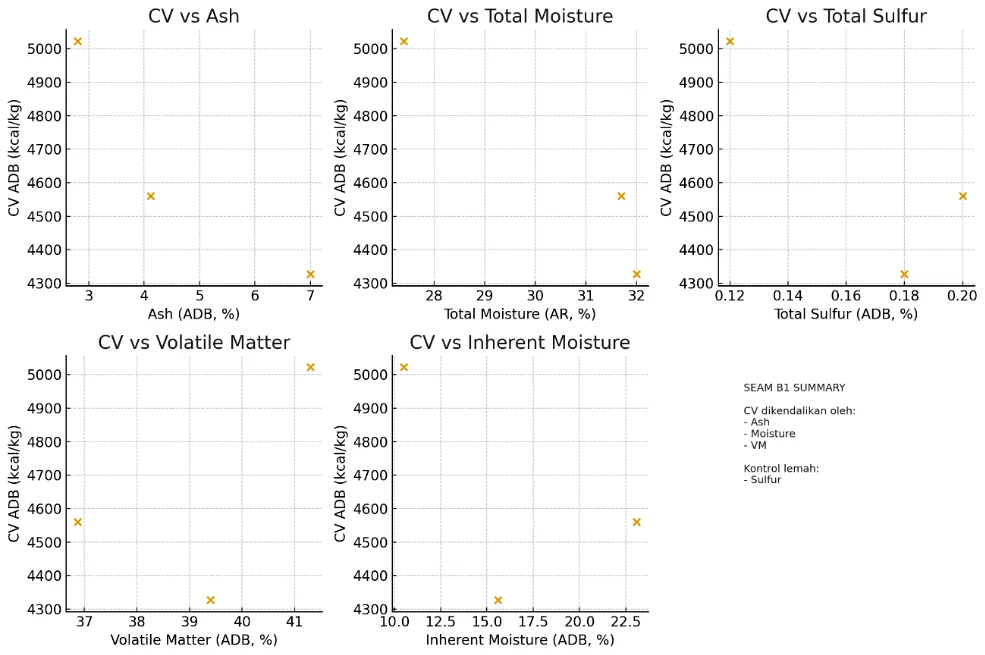
Coal-quality plots compare calorific value with the measured quality parameters for Seam B1.
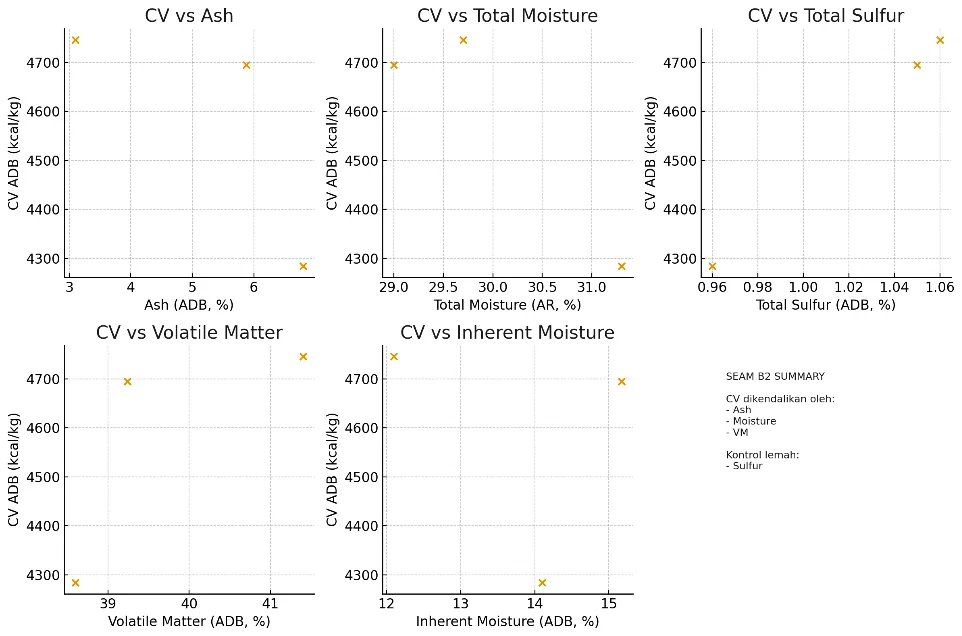
Coal-quality plots compare calorific value with the measured quality parameters for Seam B2.
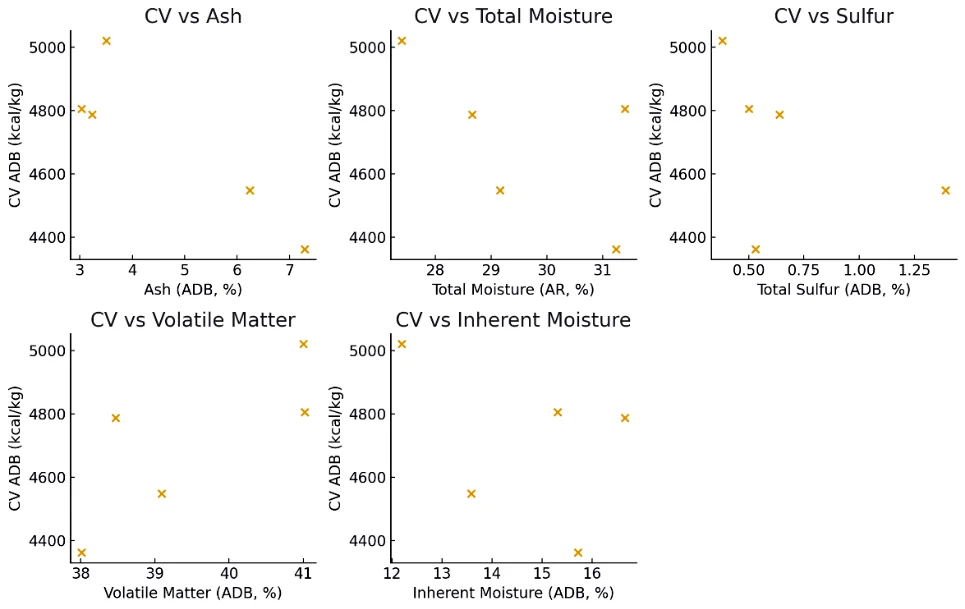
Coal-quality plots compare calorific value with the measured quality parameters for Seam C.
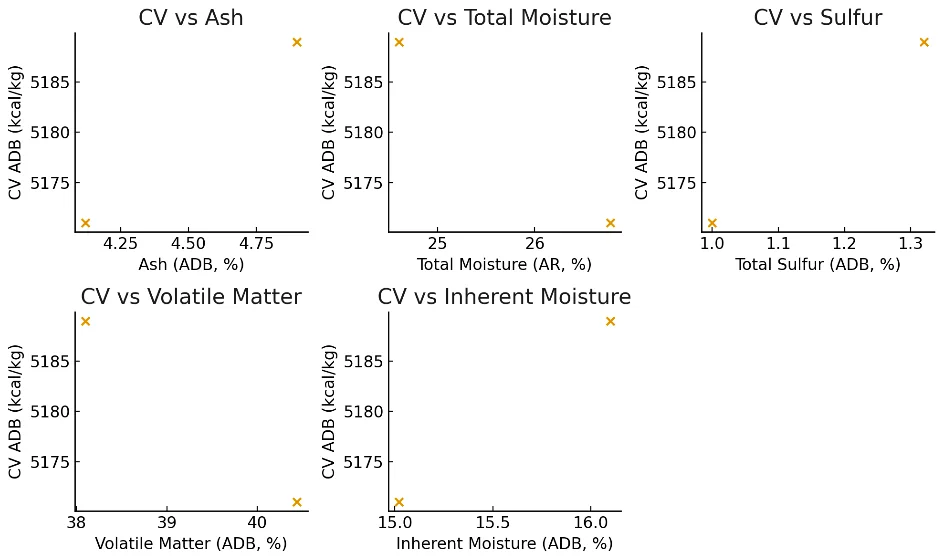
Coal-quality plots compare calorific value with the measured quality parameters for Seam D.
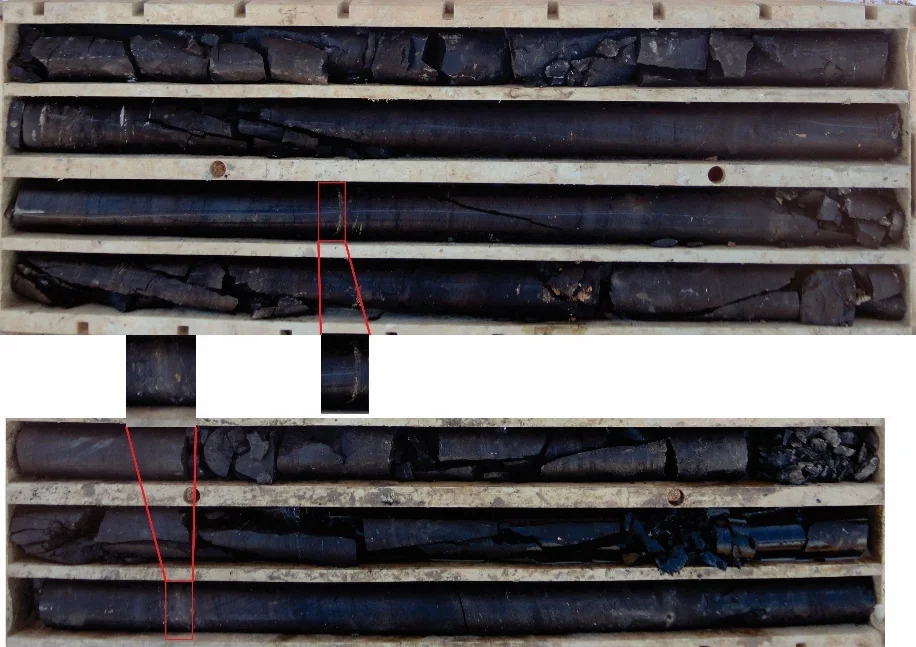
The core panel records the vertical lithologic succession through Seam D.
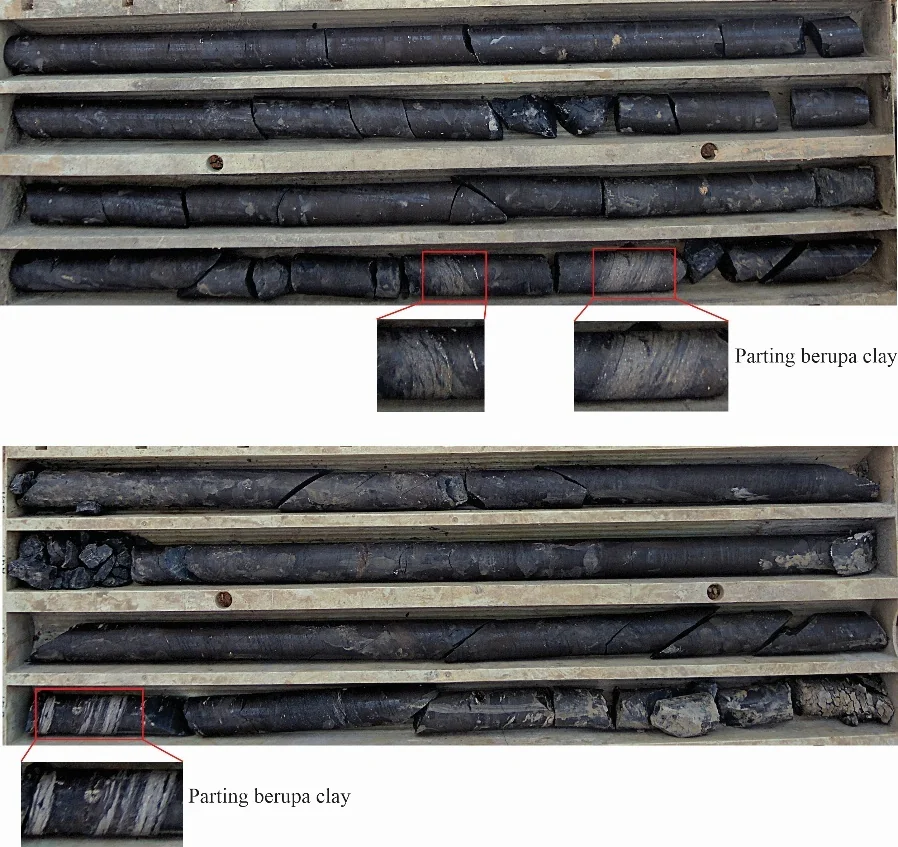
The core panel records the vertical lithologic succession through Seam C and parting.
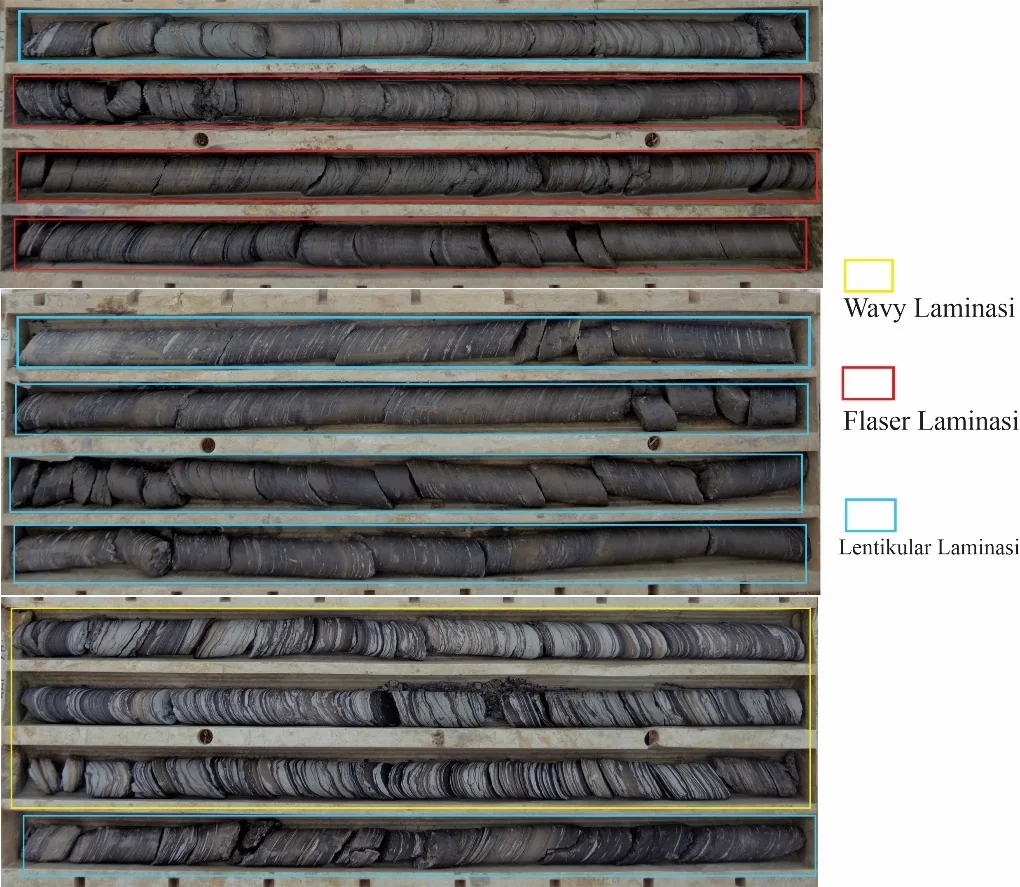
The core panel records the vertical lithologic succession through C–D interburden.
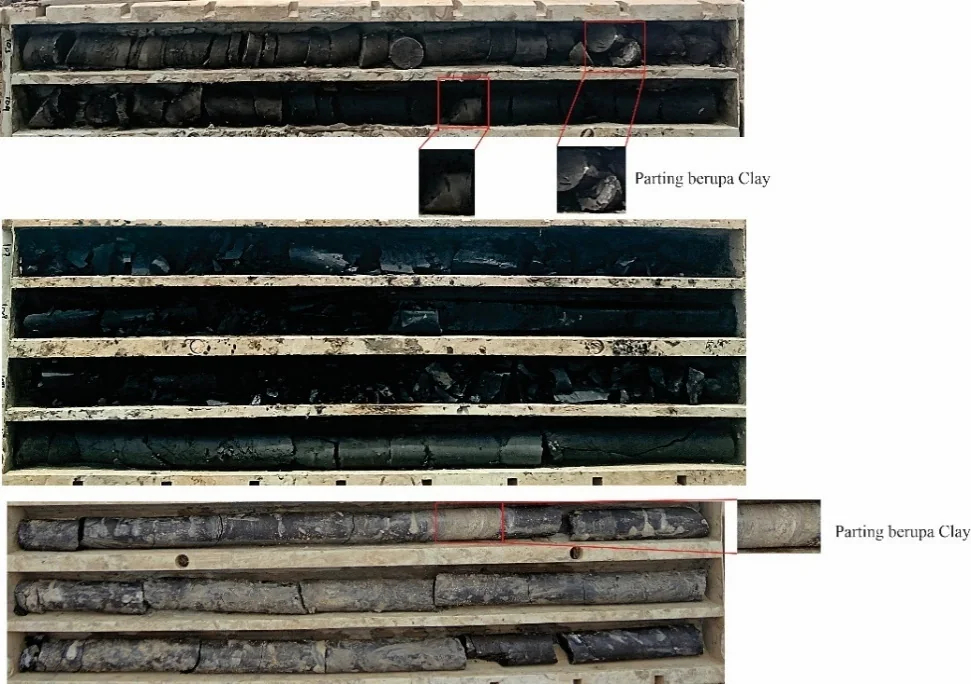
The core panel records the vertical lithologic succession through Seam B2.
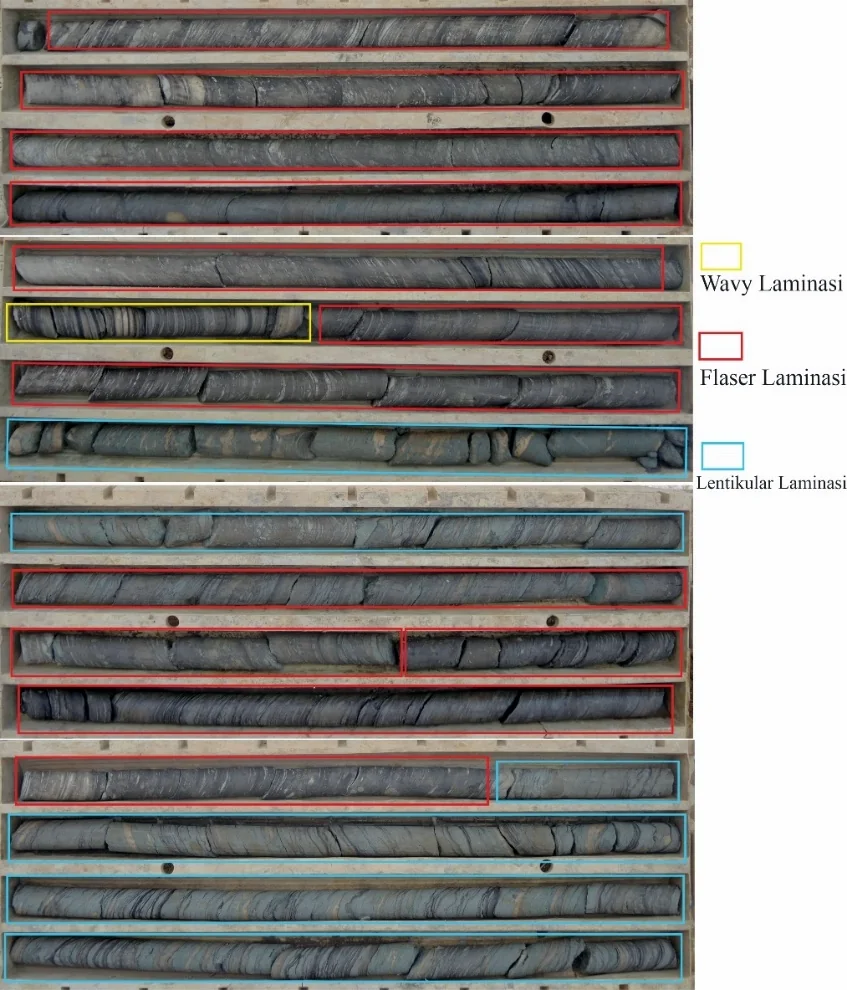
The core panel records the vertical lithologic succession through B2–C interburden.
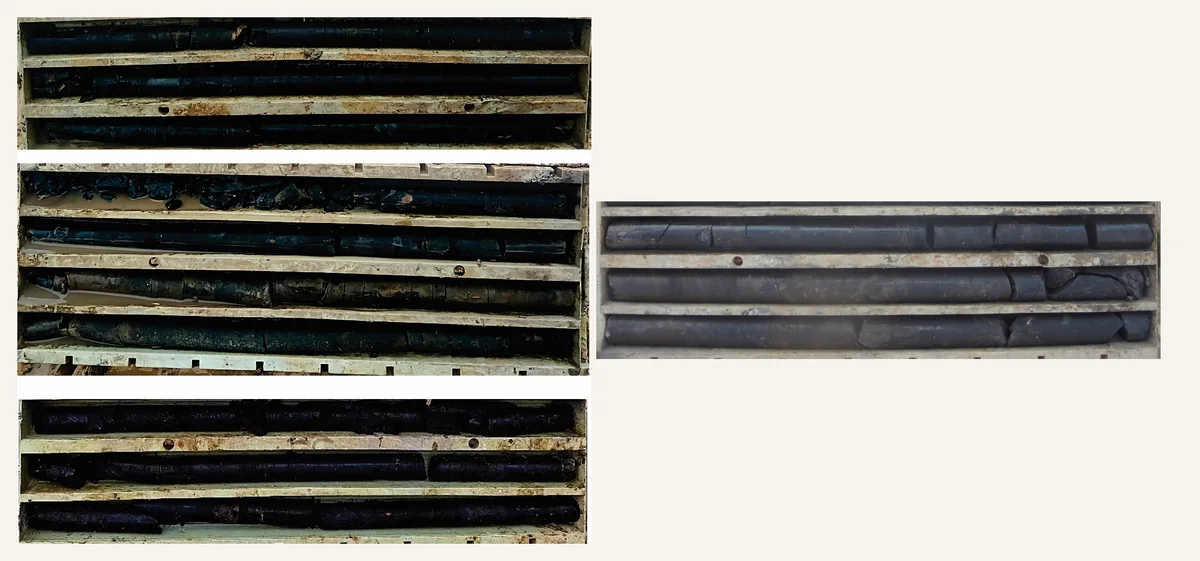
The core panel records the vertical lithologic succession through Seam B1.
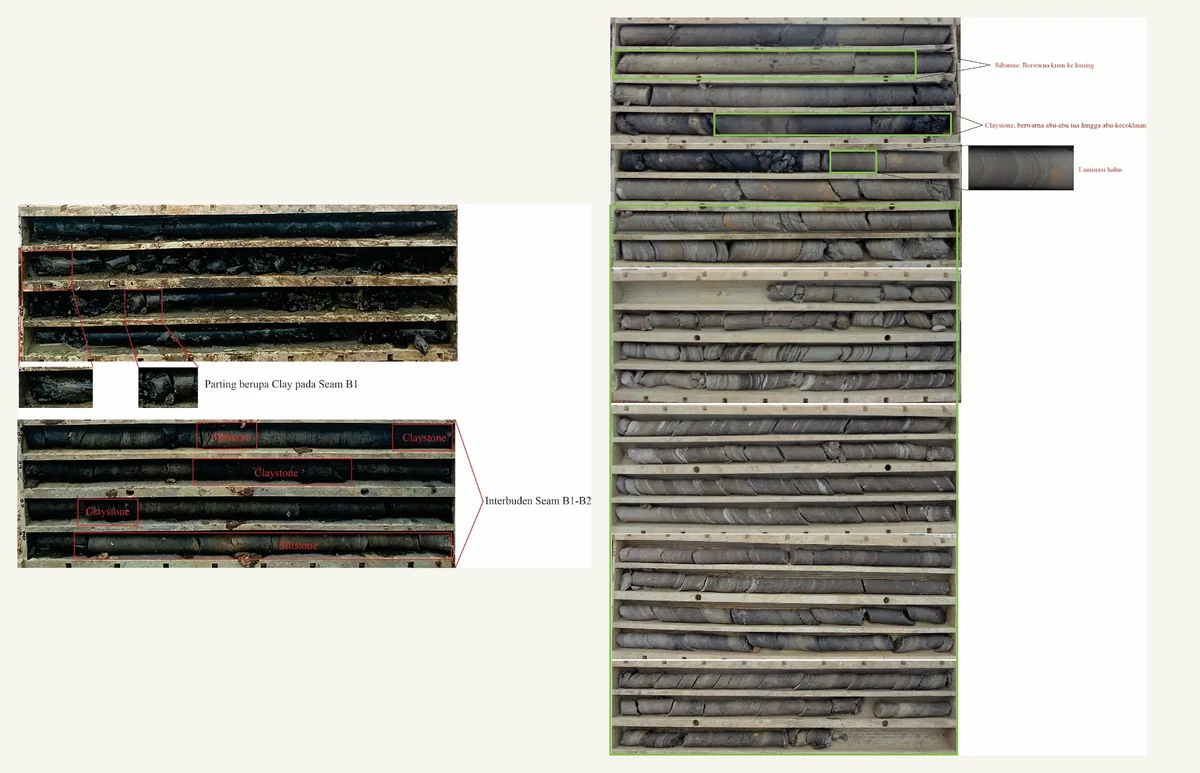
B1–B2 parting and interburden.
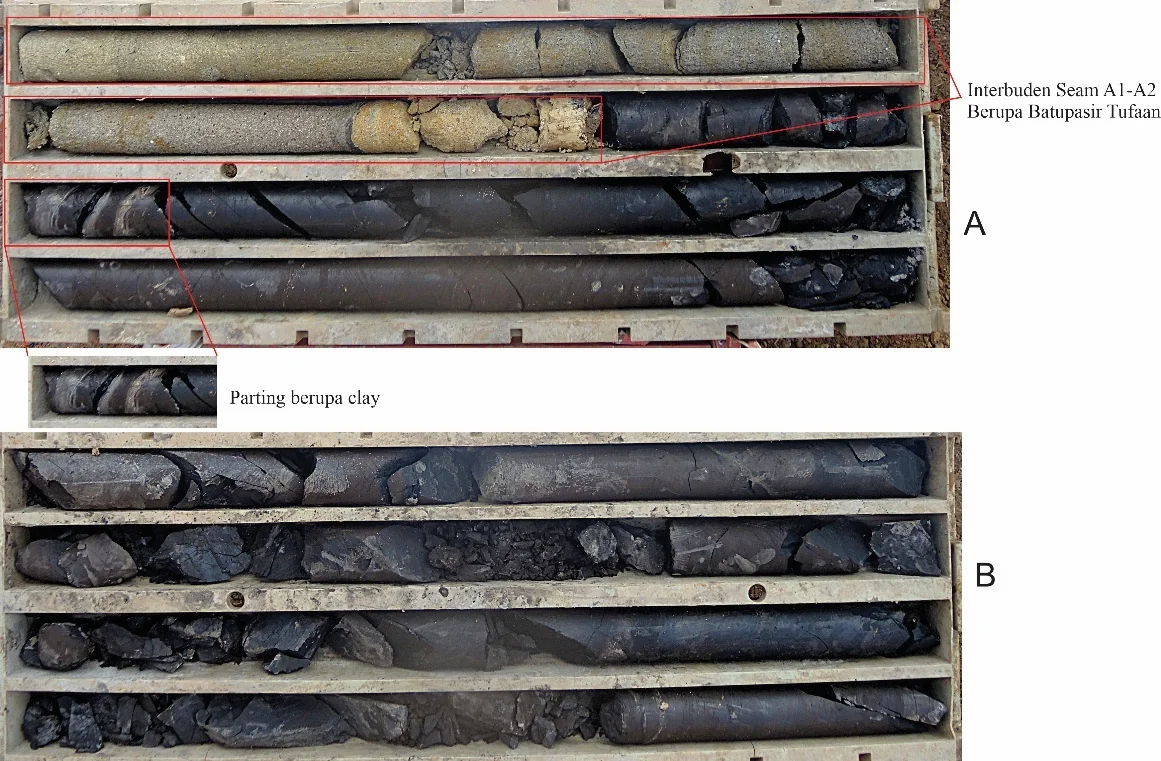
Seam A2, Seam A1 and A1–A2 interburden.
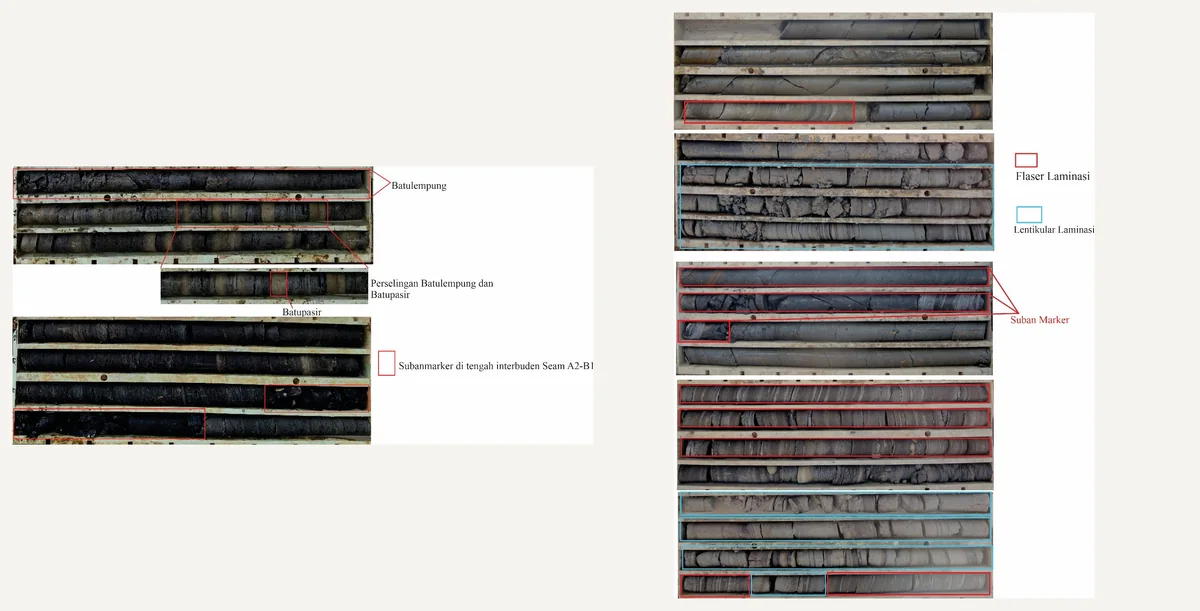
A2 interburden and marker interval.
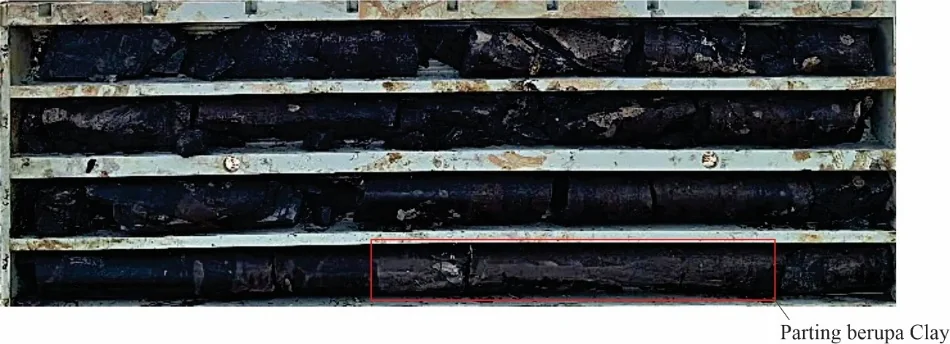
Parting within Seam A2.
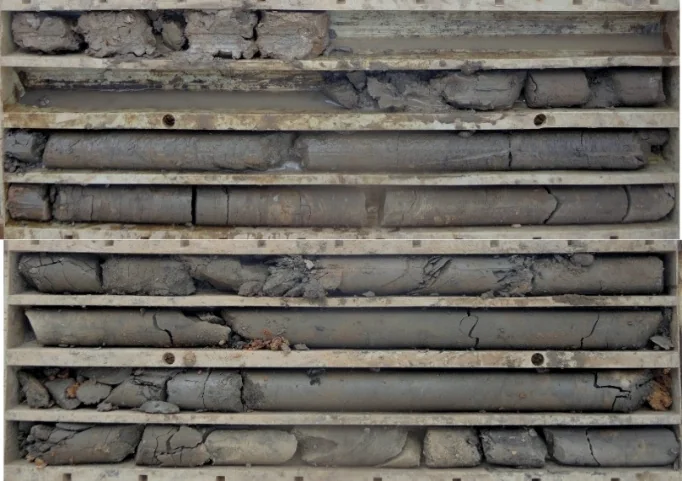
Roof of Seam A1.
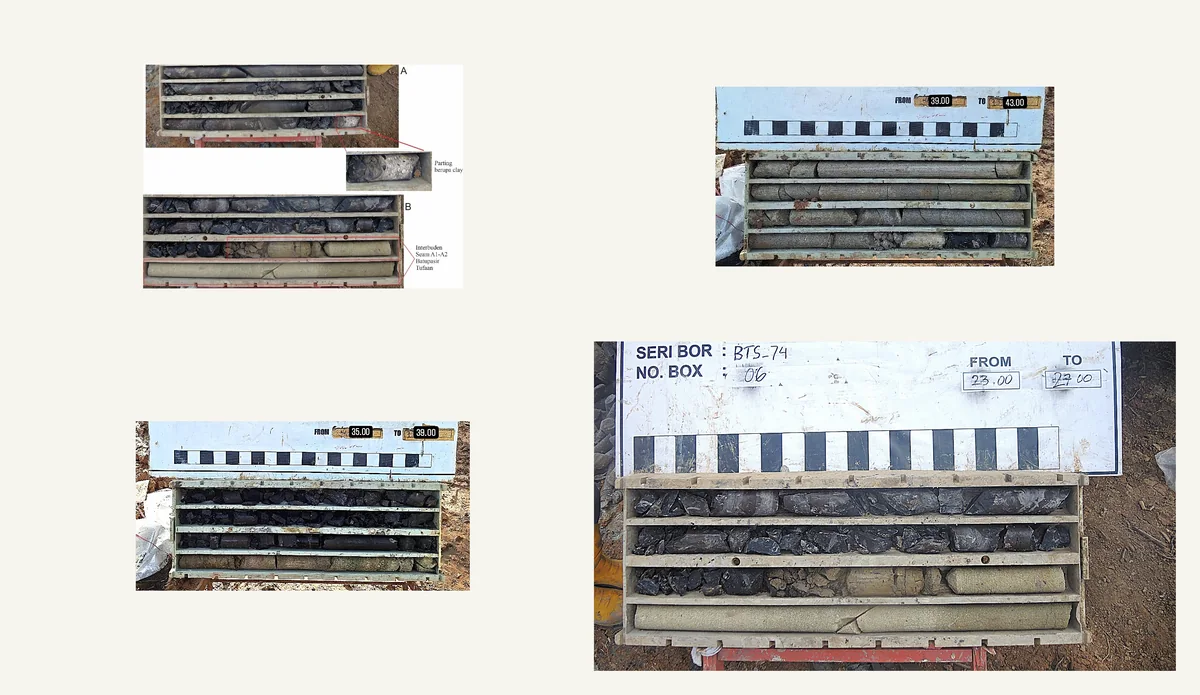
A1–A2 interburden.

Gamma-ray, lithology and correlated markers are displayed for Seam D.
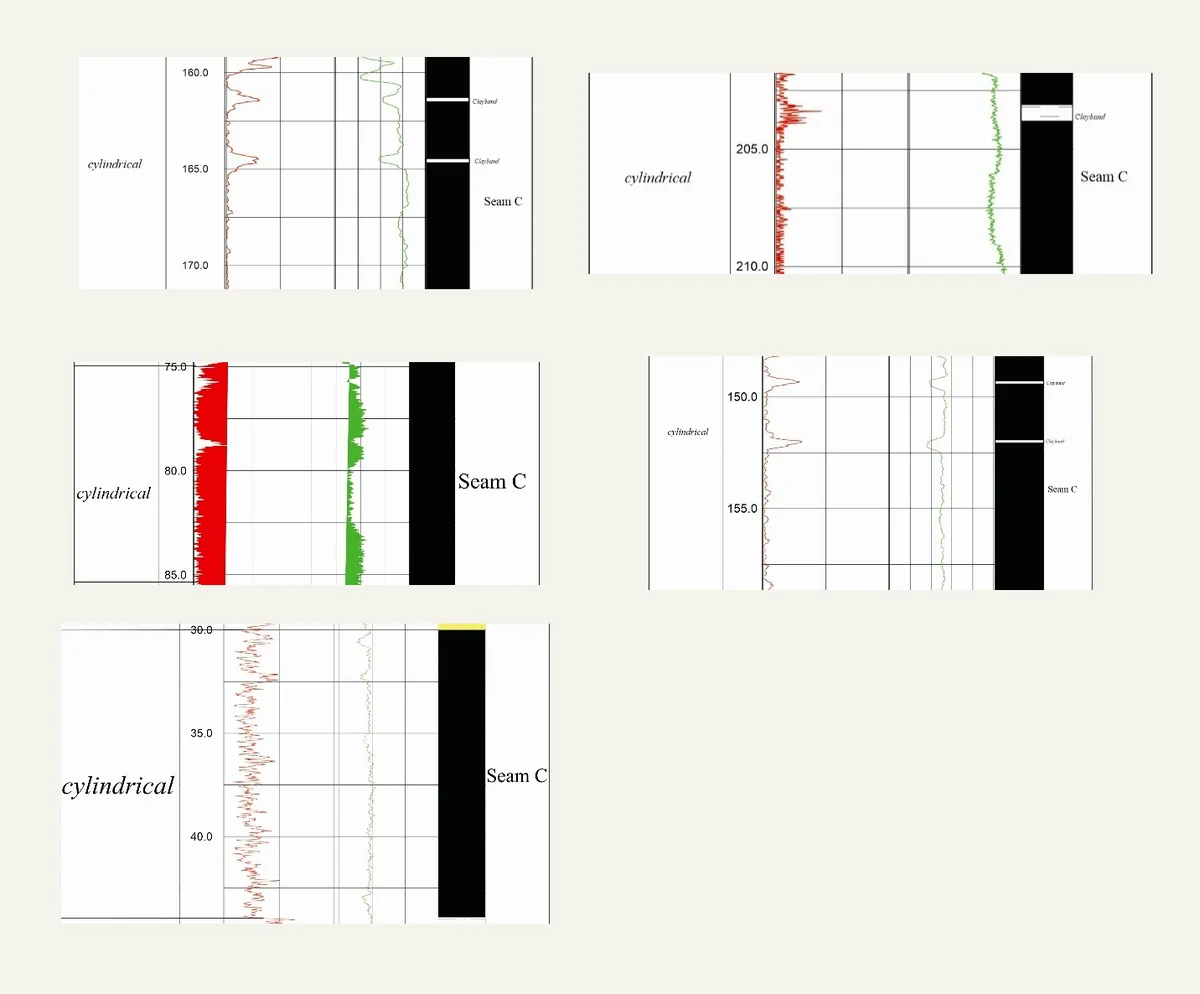
Gamma-ray, lithology and correlated markers are displayed for Seam C.
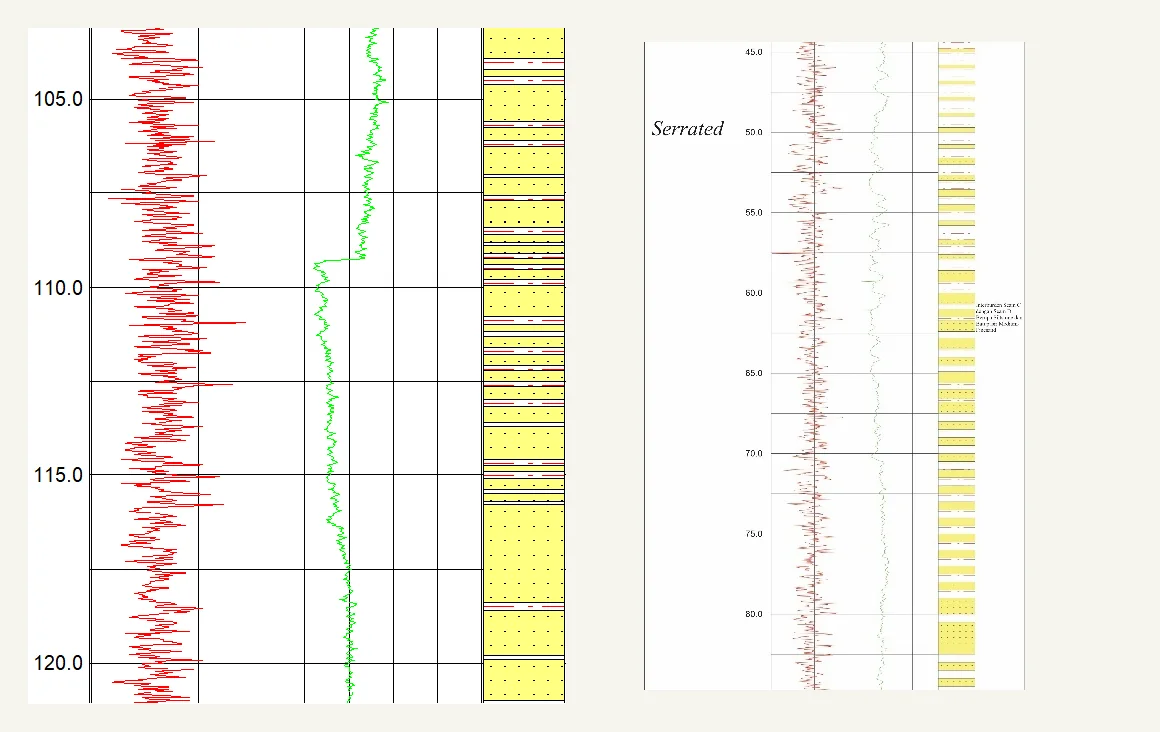
Gamma-ray, lithology and correlated markers are displayed for C–D interburden.

Gamma-ray, lithology and correlated markers are displayed for Seam B2.
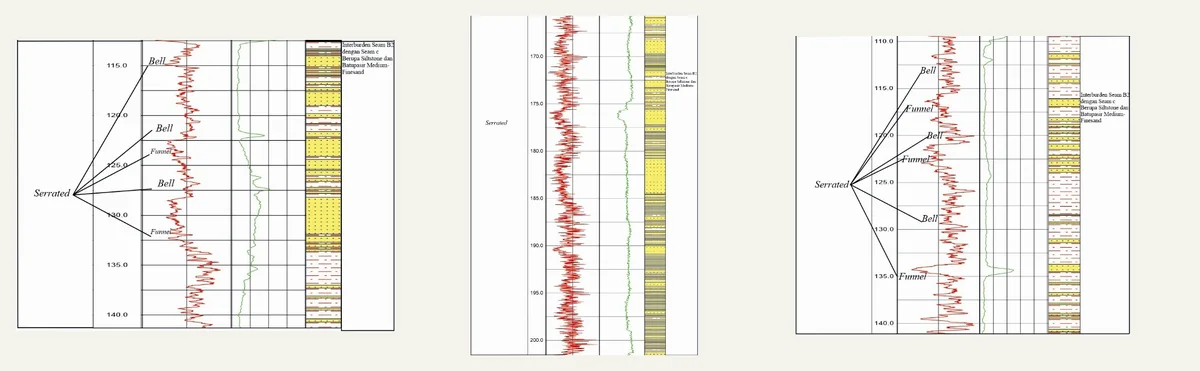
Gamma-ray, lithology and correlated markers are displayed for B2–C interburden.

Gamma-ray, lithology and correlated markers are displayed for Seam B1.
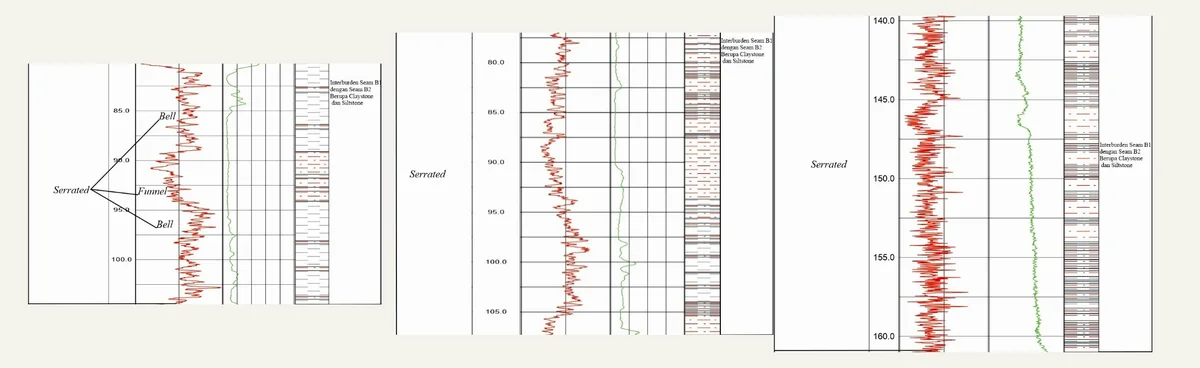
Gamma-ray, lithology and correlated markers are displayed for B1–B2 interburden.

Gamma-ray, lithology and correlated markers are displayed for Seam A2.

Gamma-ray, lithology and correlated markers are displayed for A2–B1 interburden.

Gamma-ray, lithology and correlated markers are displayed for roof of Seam A1.

Gamma-ray, lithology and correlated markers are displayed for Seam A1.

Gamma-ray, lithology and correlated markers are displayed for A1–A2 interburden.
These five linked records extend the internship report from topographic and seam-surface control into volumetric cells, geometry validation and resource-domain coding. They remain part of the 127-record software archive and are cross-linked here without being counted twice.
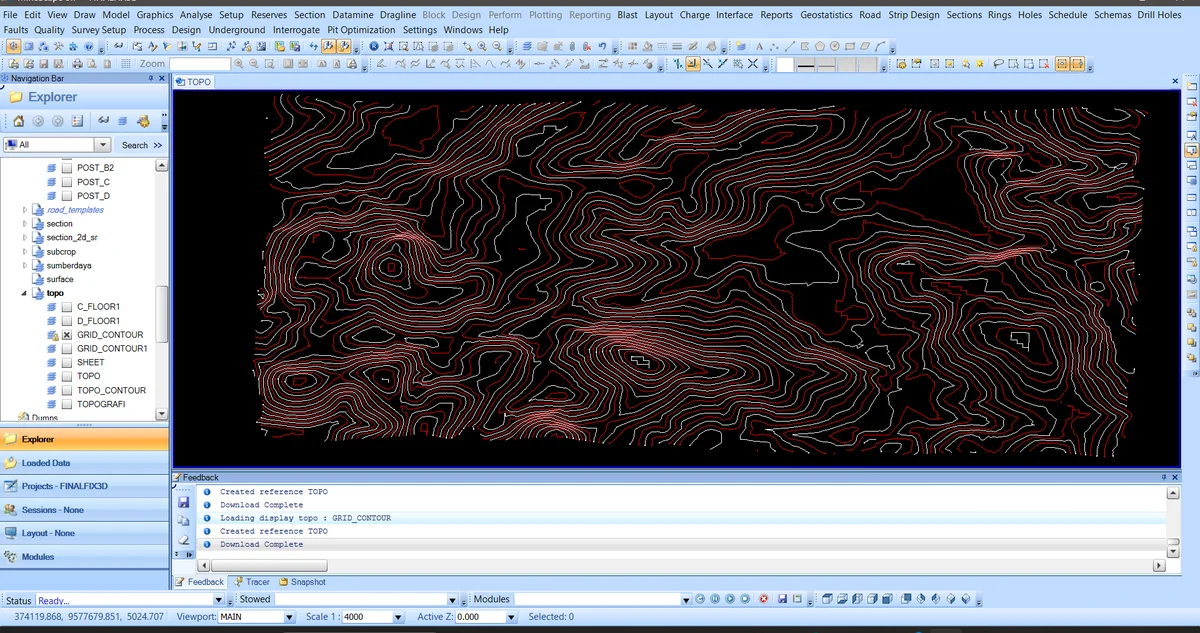
The TOPO view displays the contour network used to establish elevation control and the upper boundary of the seam model.
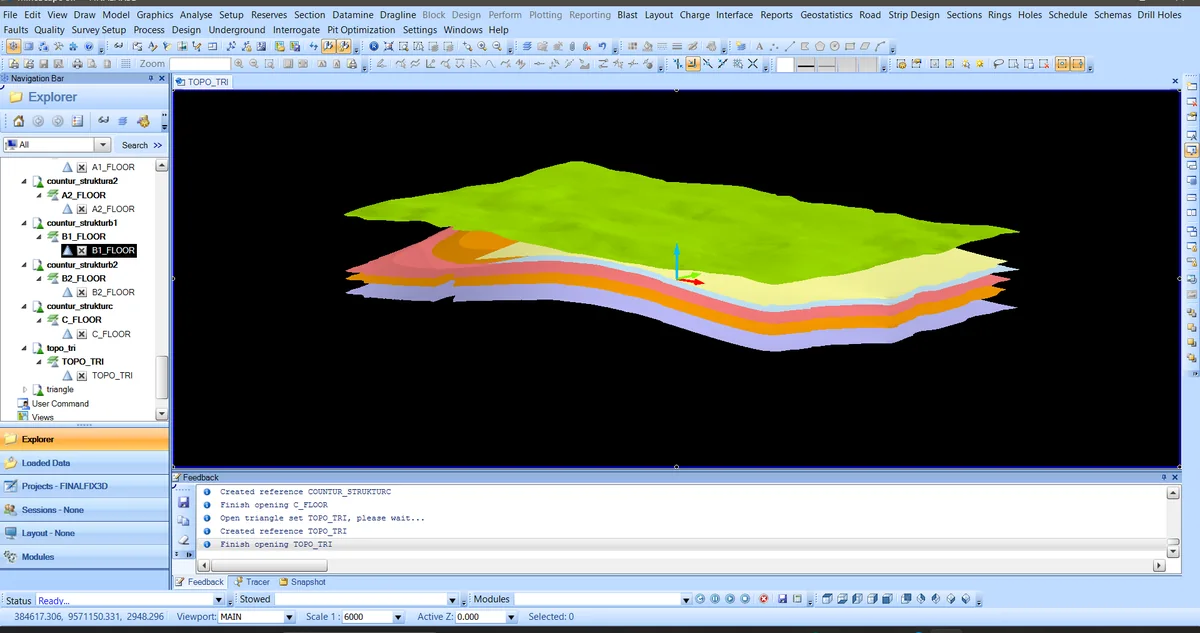
Topography and the interpreted floors of Seams A2, B1, B2 and C are displayed together to inspect stratigraphic order and lateral geometry.
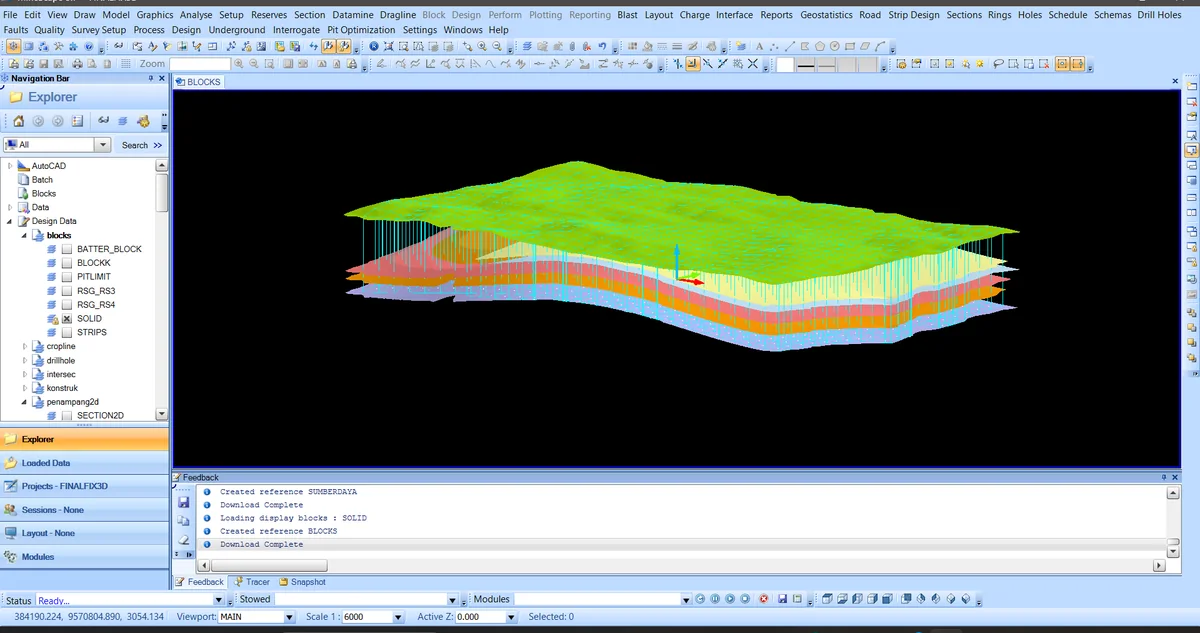
Vertical cells are generated between the model boundaries, converting the surface interpretation into a spatial framework that can carry geological attributes.
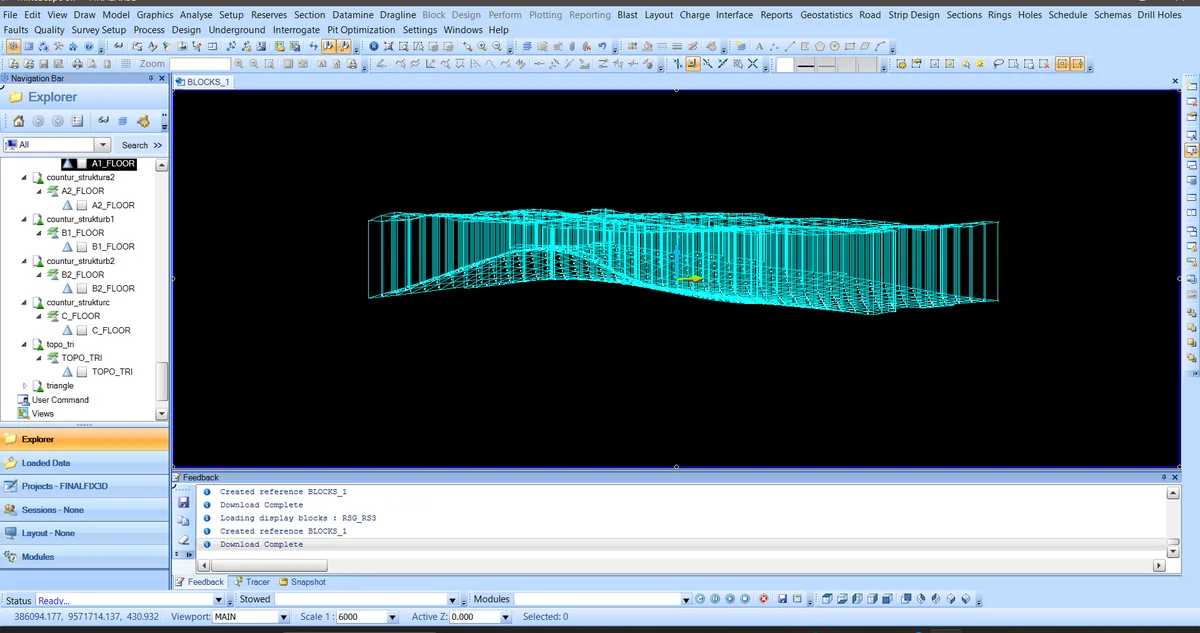
The wireframe exposes cell arrangement, lateral extent and vertical conformity to the model boundaries.
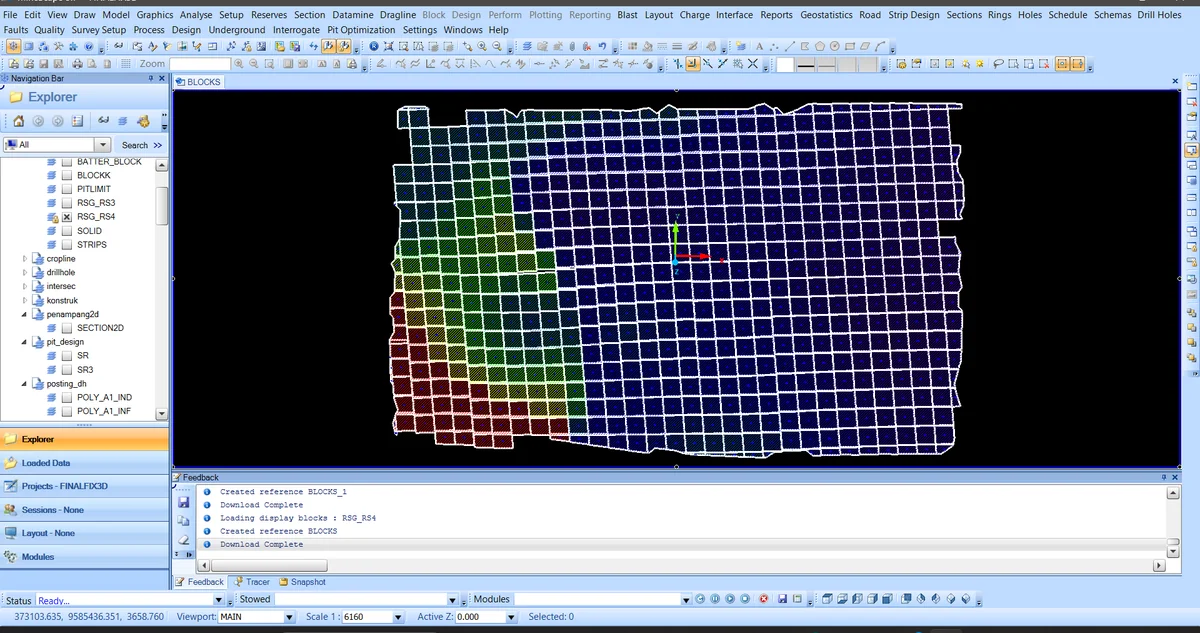
The plan view shows colour-separated cell domains alongside the controlling polygon objects.